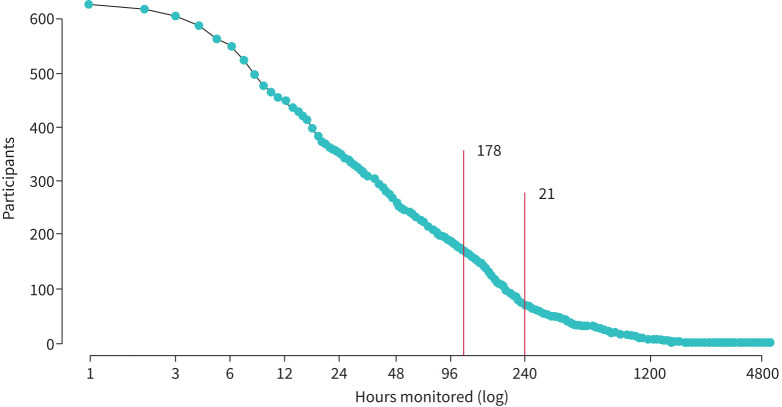
FIGURE 1.
Participants monitored as a function of monitored time. The number of participants as a function of the cumulative hours of monitoring they recorded. The red lines indicate participants who recorded for at least 100 h in which there was at least 30 min of recording (n=178), and those who recorded for 240 or more hours and had a mean cough rate of at least 0.5 coughs·h−1 (n=21).

