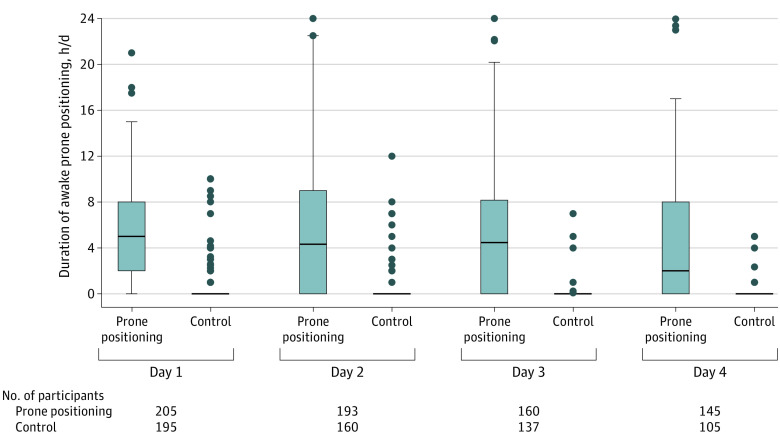
Figure 2. Duration of Awake Prone Positioning by Study Group.
The box plots display the median duration of prone positioning. The line represents the median, the box edges represent the first and third quartiles, the whiskers represent the most extreme values up to 1.5 × IQR, and the dots represent the more extreme values.

