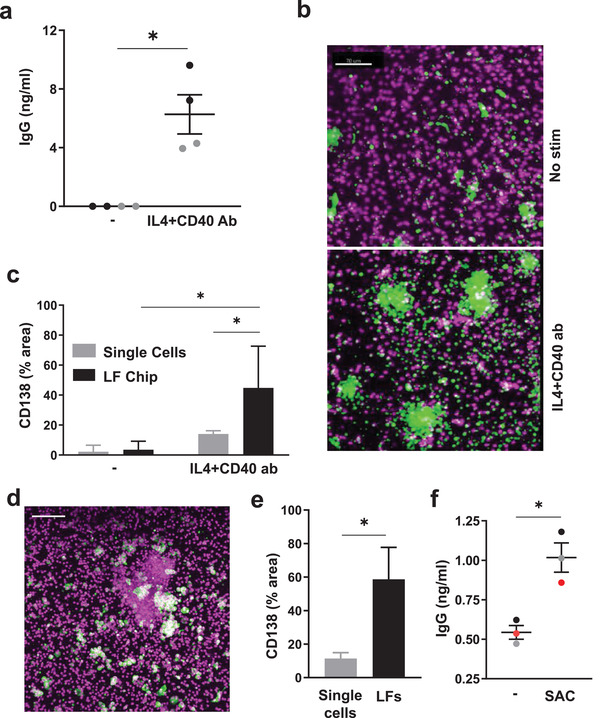
Figure 3.

B cells exhibit class switching and undergo plasma cell formation in the LF chip. a) Total IgG production measured in the effluents of LF chips when engineered with naïve B cells and bulk T cells after 6 days culture in the presence or absence (‐) of IL4 and anti‐CD40 Ab Each dot indicates results from an individual chip (n = 2) created with cells from two donors (black and gray); *, p < 0.05 using an unpaired Student's t‐test with Welch's correction. b) Immunofluorescence micrographs showing cells in unstimulated LF chips (No stim.) or chips treated with IL4 and anti‐CD40 Ab stained for CD138 (green) and nuclei (magenta); similar results are obtained with cells from 3 different donors. c) Quantification of CD138 expression in single cells (gray bars) versus cells located within LFs (black bars) in the same LF chips. Error bars indicate SD based on analysis of 5 randomly selected fields from 1 donor, and similar results are obtained with LF Chips containing cells from 3 different donors. *, p < 0.05 using a two way ANOVA to identify any significant differences followed by the Fisher's LSD test. d) Immunostaining for CD138 (green) and nuclei (magenta) in SAC‐treated LF Chips (similar results obtained with 3 donors; bar 100 µm). e) CD138 levels measured as a % of projected area labeled for CD138 in lone cells (Single Cells) versus cells in follicles (LFs) within ECM gels in perfused Organ Chips. Results shown are from 5 randomly selected fields from 1 LF Chip created with cells from one donor, and similar results are obtained with cells from 3 different donors. Error bars indicate SD; * p < 0.05 using an unpaired Student's t‐test with Welch's correction. f) Total IgG levels measured in the effluent of LF Chips 3 days after treatment with SAC. Each colored dot indicates results from one chip from each of 3 different donors. Error bars indicate standard error of mean (SEM); p < 0.05 using an unpaired Student's t‐test.
