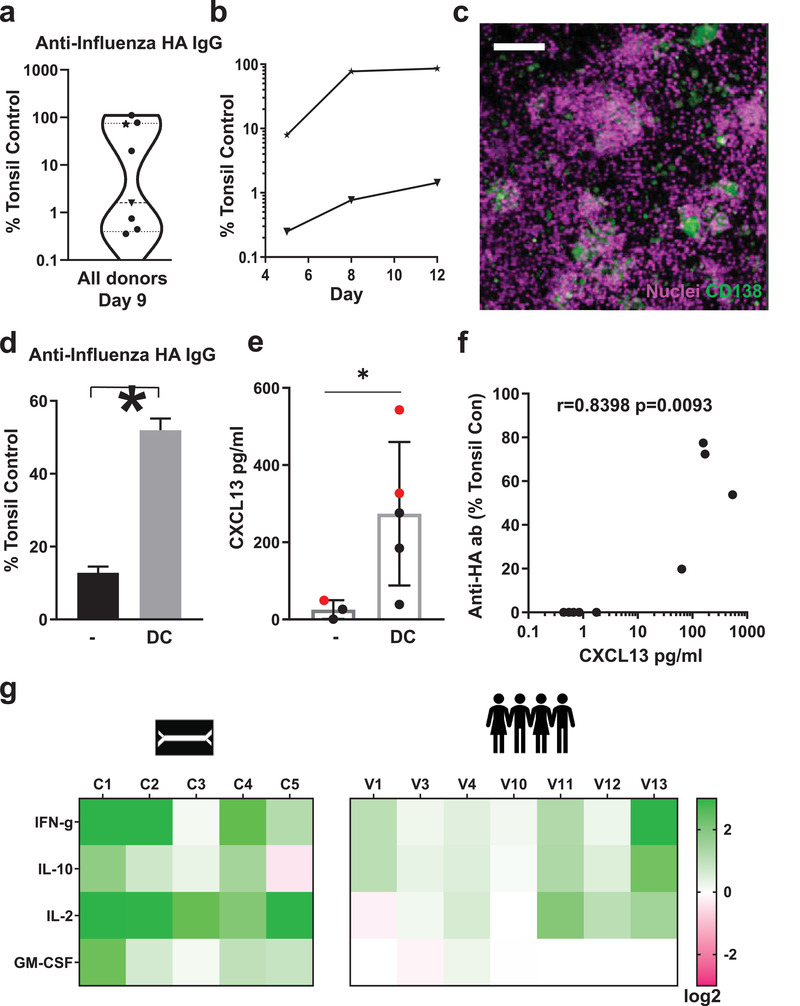
Figure 5.

Influenza vaccination in vitro in the human LF chip. a) Violin plot of anti‐HA IgG levels that are specific to the Brisbane 59 H1N1 strain (Anti‐HA IgG) in the effluent of LF Chips 9 days after vaccination with Fluzone presented relative to levels measured in a vaccinated culture of tonsillar cells (Tonsillar Control), as detected using a digital ELISA. Each data point represents average of 2–6 chips created with cells from one donor (total 8 donors tested). b) Time course of anti‐HA IgG secretion measured in chip effluents over 5 to 12 days of culture using LF Chips containing cells from representative donors from the high (★) and low (▼) Ab producer groups shown in a. c) Immunofluorescence micrograph showing CD138 staining (green) in a Fluzone‐stimulated LF Chip containing cells (nuclei, magenta) from a high anti‐HA Ab producer (similar results are obtained with 3 different high Ab producer donors; bar, 100 µm). d) Anti‐HA Ab levels that are specific to the Brisbane 59 H1N1 strain in the effluent of LF Chips with or without DCs, 9 days after vaccination, as detected by a digital ELISA, presented relative to levels measured in a culture of tonsillar cells. Mean levels from 3 replicate measurements from one chip generated from one donor are shown, and similar results are obtained in LF Chips created with cells from two different donors. Error bars indicate SD; *, p < 0.05 using an unpaired Student's t‐test with Welch's correction. e) CXCL13 levels in the effluent of the LF chip with or without DCs, 5 days after vaccination, as detected by a digital ELISA. Each colored dot represents one chip with cells from two different donors (black and red dots, n ≥ 3). Error bars indicate SD; *, p < 0.05 using an unpaired Student's t‐test with Welch's correction. f) Levels of anti‐HA Ab specific to the Brisbane 59 H1N1 strain in the effluent of LF chips at day 9 plotted relative to CXCL13 levels 5 days after vaccination. Results from 5 donors are shown with each dot representing an individual chip (n = 9); an analysis of the non‐parametric Spearman correlation between CXCL13 and IgG levels are in Graphpad Prism is shown. g) Heat map of the fold change (Log2) in the levels of cytokines (IFN‐γ, IL‐10, IL‐2, GM‐CSF) measured using a digital ELISA in effluents of LF chips generated with cells from 5 different donors, 3 days after vaccination (C1‐5) compared to unvaccinated chips, and to levels measured in peripheral blood from 7 individuals (V1, 3, 4, 10–13) 1 day after vaccination as compared to their prevaccination levels.
