
Figure 7.
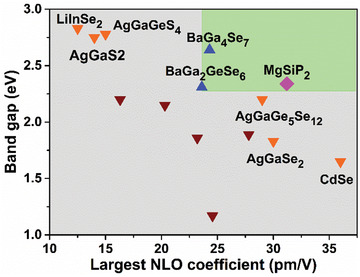
Two‐dimensional diagram presenting the balanced performance of the SHG response and band gap. The benchmark is BaGa2GeSe6 with band gap of 2.31 eV and d 11 of 23.6 pm V−1.[ 29 ] The green area represents a high balance of SHG response and band gap and the gray area is opposite. The red and orange triangle symbols represent some recently reported and the state‐of‐the‐art NLO chalcogenides, respectively.