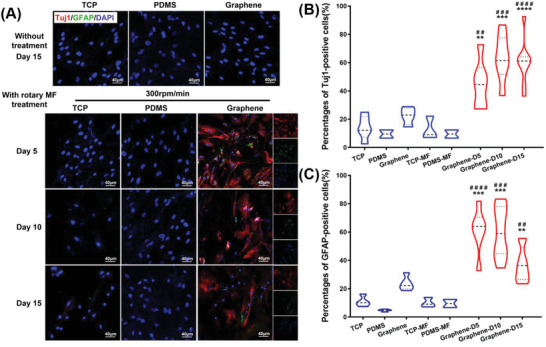
Figure 4.

Immunofluorescent staining of Tuj1 and GFAP in cells cultured on different substrates. A) Images of immunofluorescence staining for Tuj1 and GFAP in ADMSCs cultured in different samples with different treatment. Cells were stained with Tuj1 (red) for neurons, GFAP (green) for glial cells, and DAPI (blue) for nuclei. The percentages of Tuj1‐positive cells B) and GFAP‐positive cells C) were calculated and normalized to DAPI in the cell populations. **p < 0.01; ***p < 0.001; ****p < 0.0001, versus TCP group. ##p < 0.01; ###p < 0.001; ####p < 0.0001, versus graphene group without exposure to a rotating MF (n = 3).
