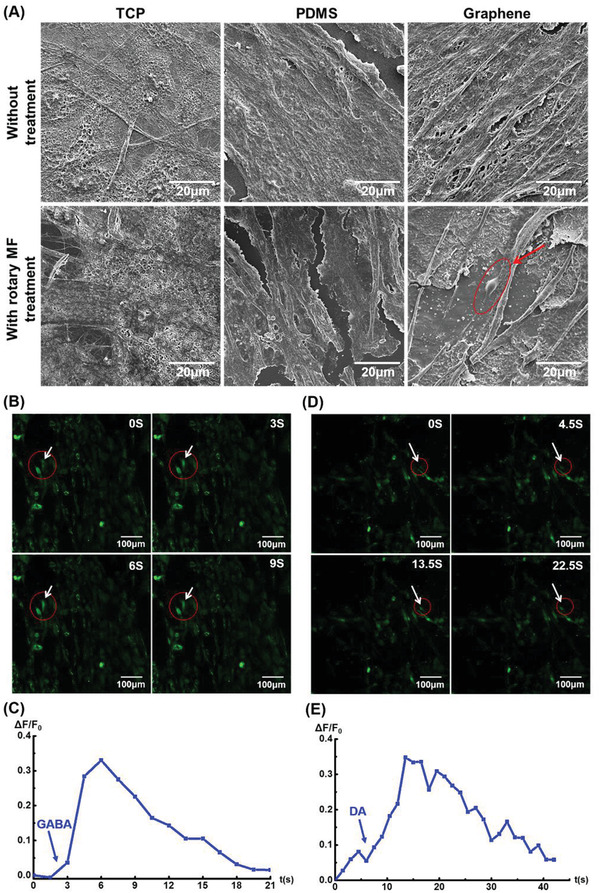
Figure 5.

Assessment of typical neuronal morphology and function in ADMSCs‐derived neurons. A) SEM images of ADMSCs cultured in different samples with different processing treatments for 15 days. B,D) Immunofluorescence micrographs to illustrate the responses of cells to neurotransmitters, γ‐aminobutyric acid (GABA), and dopamine (DA), in rotating‐MF‐treated cells, respectively (indicated by the arrow). The time (in seconds) after the administration of neurotransmitters is indicated at the top‐right corner of each panel. C,E) Relative intensity of cellular Ca2+ per cell in magnetic treatment. The arrows indicate the time when GABA or DA was added. %∆F/F 0, changes in fluorescence.
