Figure 3.
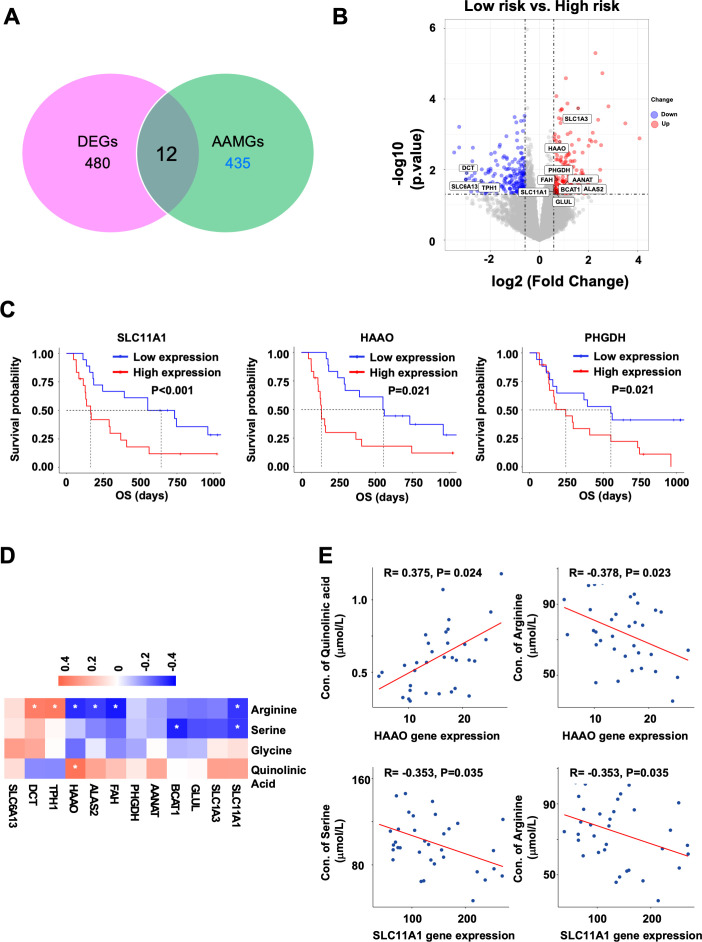
Identification of AAMGs differentially expressed between the high-risk and low-risk groups. (A) Venn plot of AAMGs among the DEGs. (B) Volcano plot of DEGs. AAMGs were labeled in the plot with gene names. Red dots, upregulated genes; blue dots: downregulated genes; gray dots, stable genes. (C) Kaplan-Meier estimates of OS in the subgroups stratified by RNA expression level of three AAMGs, SLC11A1, HAAO, and PHGDH, in PBMCs. Cut-off values between the high and low groups were set at the median of gene expression levels. P values (log-rank test) are shown. (D) Correlations between 12 DEG–AAMGs in PBMCs and PFAAs/tryptophan metabolites. Heatmap of Spearman’s correlations between expression levels of 12 DEG–AAMGs and concentrations of 4 PFAAs/metabolites selected in the multivariate model (arginine, serine, glycine, and quinolinic acid) are shown. Red, positive correlation; blue, negative correlation; white, no correlation. (E) Scatter plots of the HAAO gene expression in PBMCs versus concentrations of quinolinic acid or arginine (left half). Scatter plots of the SLC11A1 gene expression in PBMCs verus concentrations of serine or arginine (right half). The correlations were evaluated by Spearman’s rank correlation coefficient analysis. R indicates correlation coefficient. amino acid metabolism-related gene; DEG, differentially expressed gene; HAAO, 3-Hydroxy Anthranilic Acid Dioxygenase; OS, overall survival; PFAA, plasma-free amino acid.

