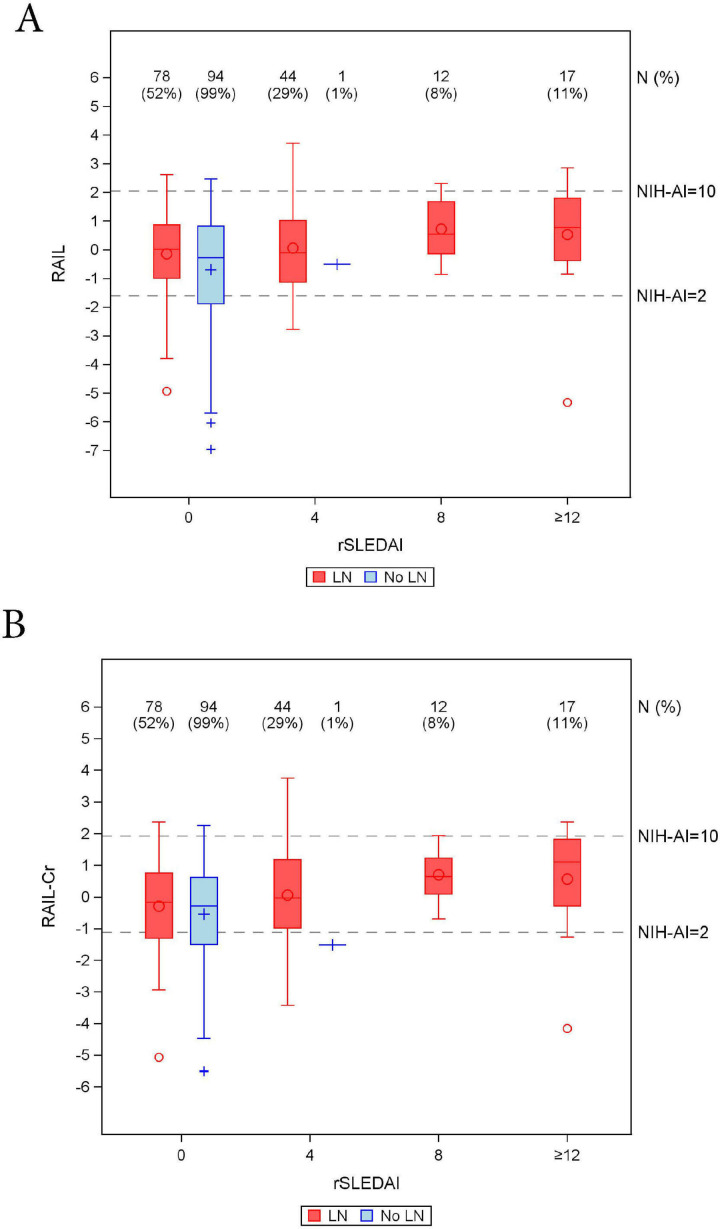
Figure 4.
Distribution of renal activity index for lupus (RAIL) (A) and RAIL standardised for urine creatinine (RAIL-Cr) (B) scores in relation to SLE disease activity index (rSLEDAI) scores from 246 samples from patients collected >3 months before/after kidney biopsy. Box-Whisker plots of RAIL score (y-axis, A) or RAIL-Cr (y-axis, B) by rSLEDAI (x-axis) in patients with lupus nephritis (LN) (red colour) and no-LN (blue colour), where medians, IQR, maximum, minimum and outliers are shown. The number of urine samples (N%) for each box is outlined above the x-axis along with the percentage out of a total of 151 LN samples and 95 no-LN samples. Based on data in figure 3, the grey dash lines indicate the RAIL scores corresponding to NIH-AI of 2 and 10.

