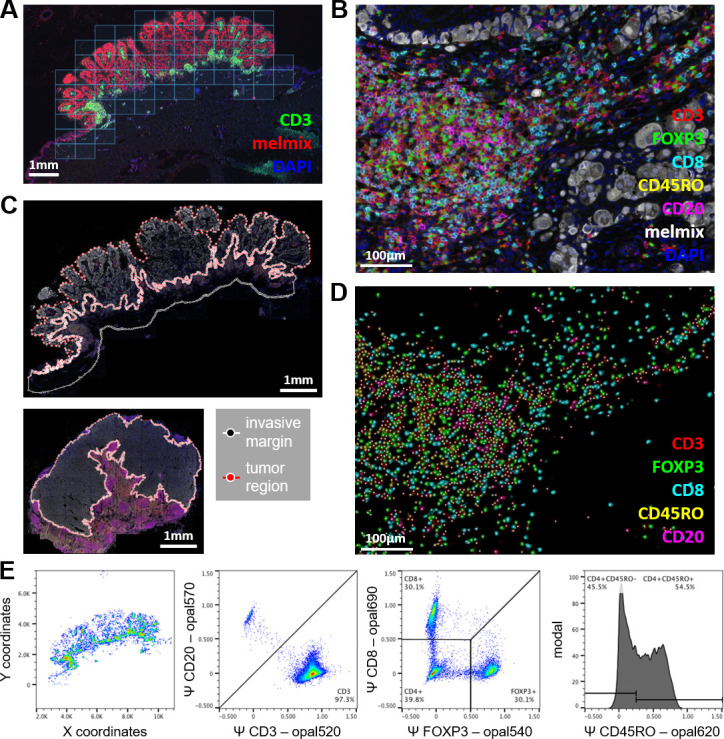
Figure 1.

Multiplex imaging and data processing of the melanoma tumor microenvironment. (A) Multiplex stained slides were prescanned at 4× and tiles of 20× multispectral imaging were selected using Phenochart. Tissues were scanned completely with surrounding tiles for the invasive margin. (B) Images were unmixed using inForm to visualize the markers: CD3 (red), FOXP3 (green), CD8 (cyan), CD45RO (yellow), CD20 (magenta), melmix (white), DAPI (blue) and autofluorescence (not shown). (C) ROI for tumor and, if possible, invasive margin of ~0.5 mm thickness, were manually selected on scanned tissues. Upper image represents the primary tumor and the lower image a lymph node metastasis. (D) Lymphocytes were identified based on marker expression using a machine-learning algorithm. Colors show inferred intensity of surface marker expression for cells detected by the algorithm. (E) Lymphocytes that are recognized by the machine-learning algorithm were exported as FCS file and were phenotyped based on inferred marker expression. (D) using a gating strategy that first separated T-cells (CD3+CD20−) from B-cells (CD3−CD20+). Next, T cells were further separated into cytotoxic T cells (CD3+CD8+FOXP3−), regulatory T cells (CD3+CD8+FOXP3-) and helper T cells (CD3+CD8−FOXP3−). Cytotoxic T cells, regulatory T cells, and helper T cells can be further divided by CD45RO expression (CD45RO signal on helper T cells are shown in this example). FCS, flow cytometry standard; ROI, region of interest.
