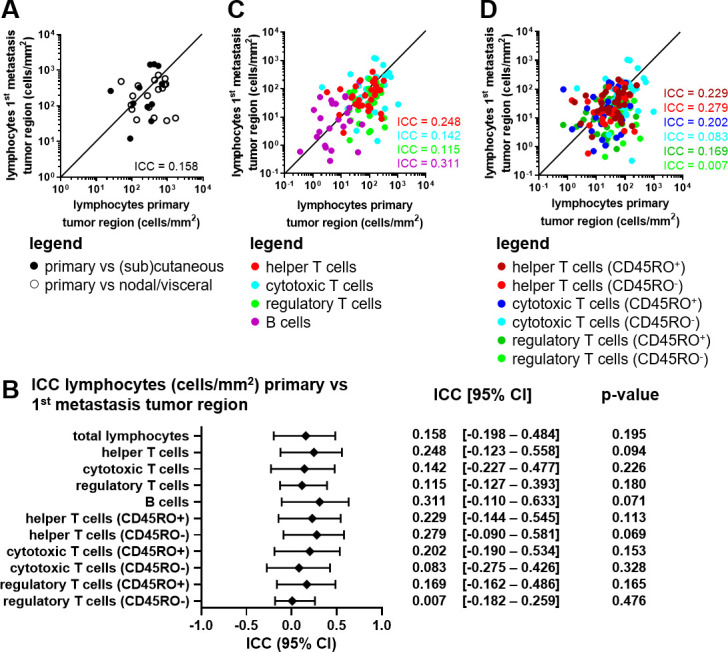
Figure 3.

Analysis of lymphocyte subsets in paired primary and metastatic melanoma lesions. (A) Correlation plot of the total lymphocyte density (cells/mm2) in the tumor region of the primary tumor versus the first metastatic lesion. Closed dots represent paired primary cutaneous tumors with metastatic tumors at (sub)cutaneous locations. Open dots represent paired primary cutaneous tumors with metastatic tumors at nodal or visceral locations. (B) ICC value, 95% CI and p value per phenotype in the tumor region of the primary tumor versus the first metastatic lesion. (C) Correlation plot of the lymphocyte subset densities (cells/mm2) in the tumor region of the primary tumor versus the first metastatic lesion. (D) Correlation plot of the lymphocyte CD45RO+/- subset densities (cells/mm2) in the tumor region of the primary tumor versus the first metastatic lesion. (A–D) Concordance is shown and quantified using the ICC. n=29. ICC, intraclass correlation coefficient.
