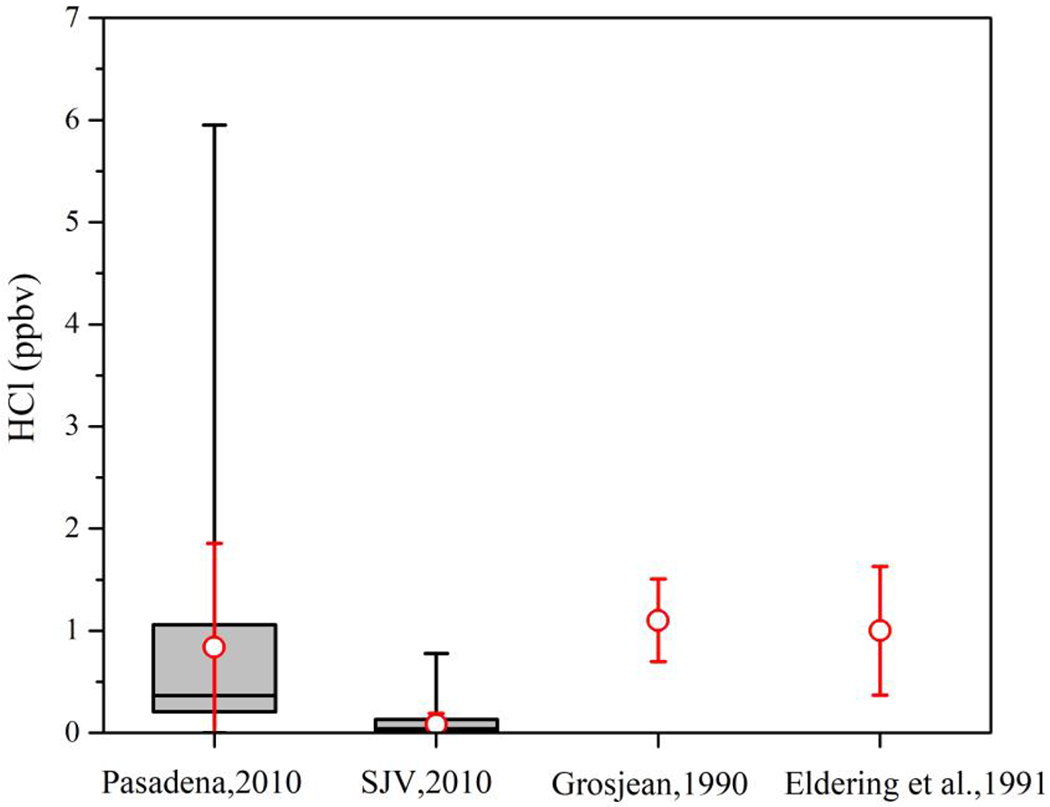
Figure 2.

Distributions of HCl measured at or near the CalNex 2010 Pasadena and SJV site, the May 15 to June 30 observations (n=7) of Eldering et al. [1991], August 12-21 data (n=43) of Grosjean [1990]. The prior studies were both conducted in the SoCAB, with comparison sites selected for proximity to Pasadena. The black box and whiskers represent the central 50% (box) and max and min of the CalNex observation, while the red circle and error bars are the observation averages ± 1σ.
