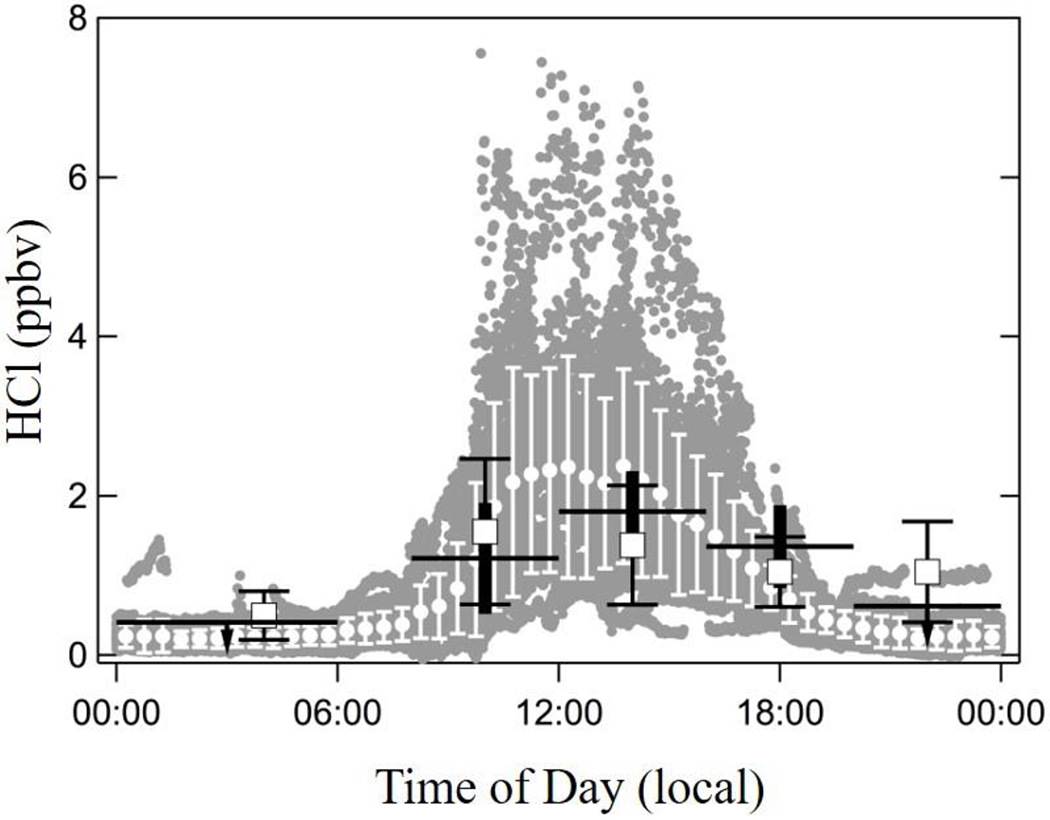
Figure 3.

Measurements of HCl versus time of day. The one-minute averages from Pasadena are shown as grey circles and the half hour averages are shown as white points with the error bars indicating ±1σ. Data from 11-17 September 1985 - taken at Claremont CA - are shown as horizontal lines with thick vertical bars that indicate ±1σ. Note that the 00:00-06:00 and 20:00-24:00 numbers are upper limits [Appel et al., 1991]. Data from 12-21 August 1986 taken at Glendora, CA, are shown as open squares with narrow capped error bars that indicate ±1σ [Grosjean, 1990].
