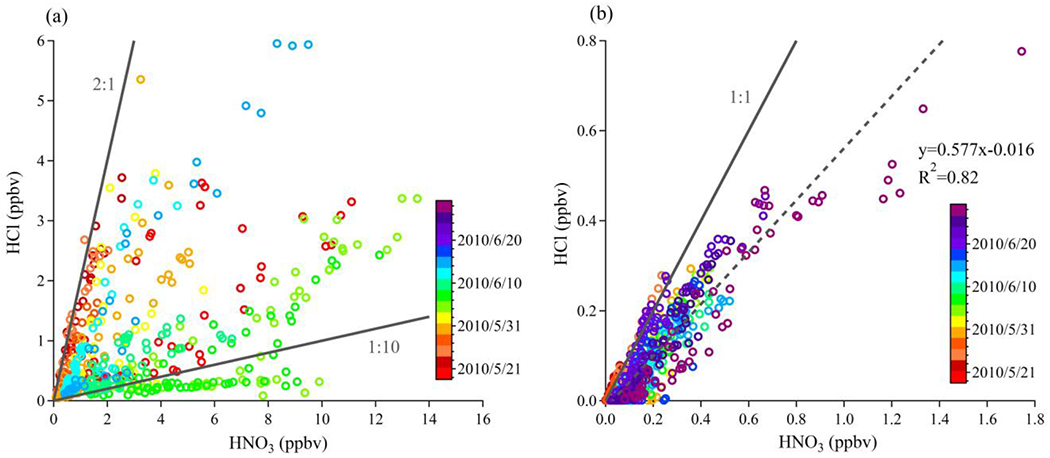
Figure 4.

Correlations of HCl with HNO3 colored by observation date for the CalNex 2010 datasets at: (a) the Pasadena site and (b) the SJV site. Note that observations at Pasadena ended before those at SJV (see Fig.1). Due to the wide variance in the relationship between these species in Pasadena, the range of ratios from 2:1 to 1:10 is denoted using solid black lines. At the SJV site, the 1:1 ratio is denoted by the solid black line, while the orthogonal least-squares linear regression fit is shown with the dashed grey line.
