Figure 8.

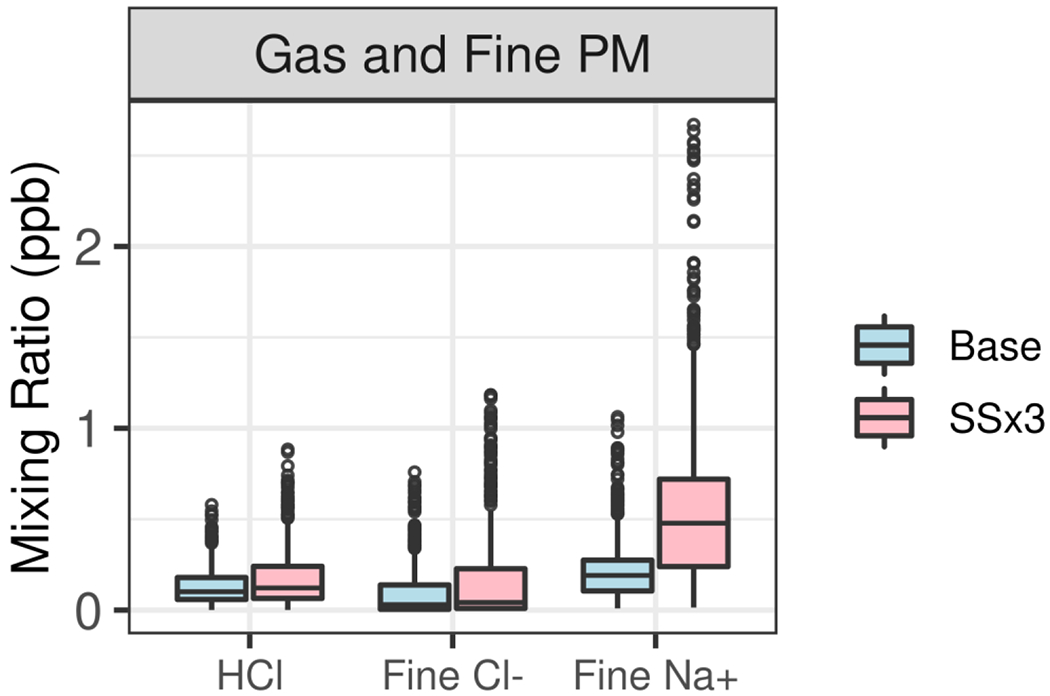
Modeled distributions of HCl and fine particle sodium and chloride and at the Pasadena site during 15 May to 15 June 2010. Circles represent values greater than 1.5 times the interquartile range from either end of the box.

Modeled distributions of HCl and fine particle sodium and chloride and at the Pasadena site during 15 May to 15 June 2010. Circles represent values greater than 1.5 times the interquartile range from either end of the box.