Figure 2.
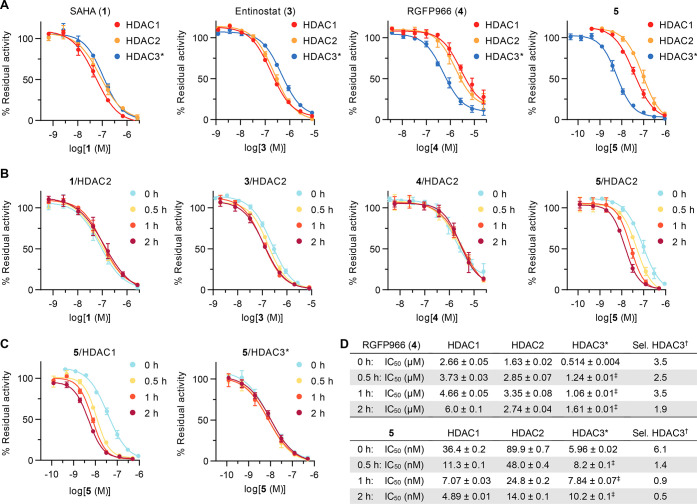
Discontinuous inhibition of HDACs 1–3. (A) Dose–response curves measured after reaction of the enzyme and substrate for 30 min. (B) HDAC2 curves after preincubation with the enzyme for 0, 0.5, 1, or 2 h followed by addition of the substrate and reaction for 30 min. (C) HDAC1 and HDAC3 curves of compound 5 with and without preincubation. See Figure S1A,B for additional HDAC1 and HDAC3 curves. (D) IC50 data for compounds 4 and 5 and selectivity of HDAC3 inhibition. See Figure S1C for data for compounds 1 and 3. All data represent mean ± SD, n ≥ 2. *HDAC3 was incubated with the deacetylase activation domain (DAD) of NCoR2. †The selectivity was calculated vs the second-most-inhibited enzyme (HDAC2 for 4, HDAC1 for 5) by transformation of IC50 data into Ki values and calculation of the ratio (see data analysis in the Supporting Information). ‡Data were obtained in buffer without reducing agents or surfactants (see Figure S2 and preincubation methods in the Supporting Information for choice of buffer).

