
Figure 5.
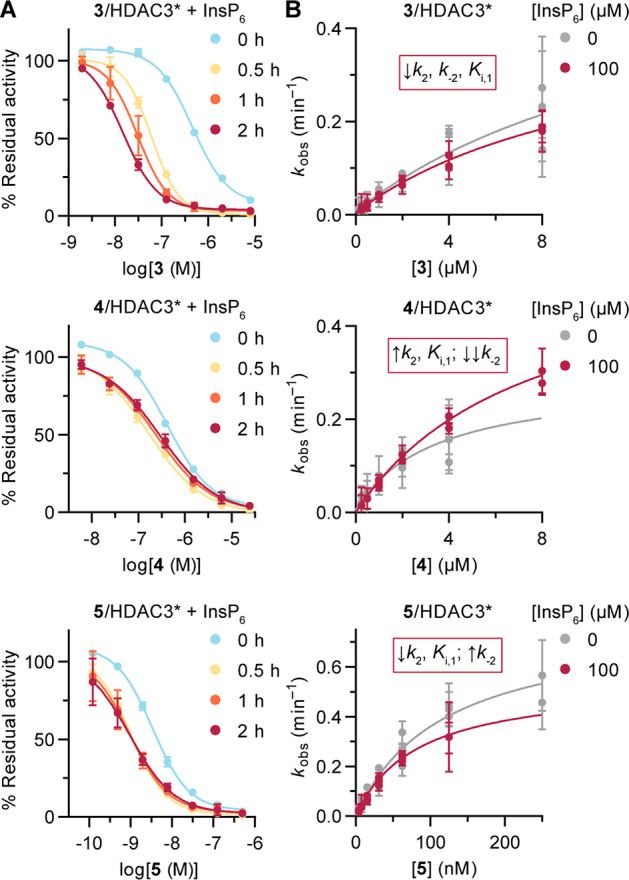
Inhibition of HDAC3 in the presence of inositol hexaphosphate (InsP6). (A) Curves for compounds 3, 4, and 5 with and without preincubation, measured in buffer without reducing agents or surfactants. See Figure S7A,B for curves for compound 1 and for IC50 and selectivity data. Data represent mean ± SD, n = 2. (B) kobs secondary plots for compounds 3, 4, and 5 with and without InsP6. Data represent mean ± SEM of individual experiments, with each experiment performed at least twice. See Figure S7C,D for progression curves and numerical data. A summary of data changes with InsP6 is provided for each compound. *The HDAC3 preparation contained the DAD of NCoR2.