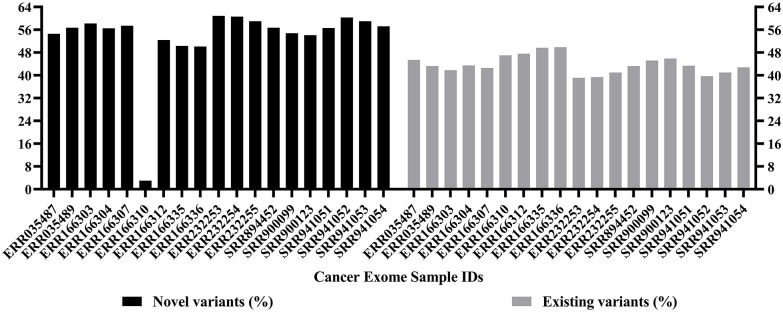
Figure 2.
Bar plot showing the percentage of novel and existing variants identified by variant calling. X-axis shows the sample IDs while y-axis shows the percentage of novel and existing variants. The sample ID SRR941052 was found to have 60.3% of novel variants and 59% of novel variants were observed in SRR941053 and ERR232255. Further, 49.9% of existing variants were observed in ERR166336, 49.7% in ERR166335, and 47.6% in ERR166312. Several novels and existing variants were called; however, organized and meaningful data were obtained only after normalization.

