Fig. 3.
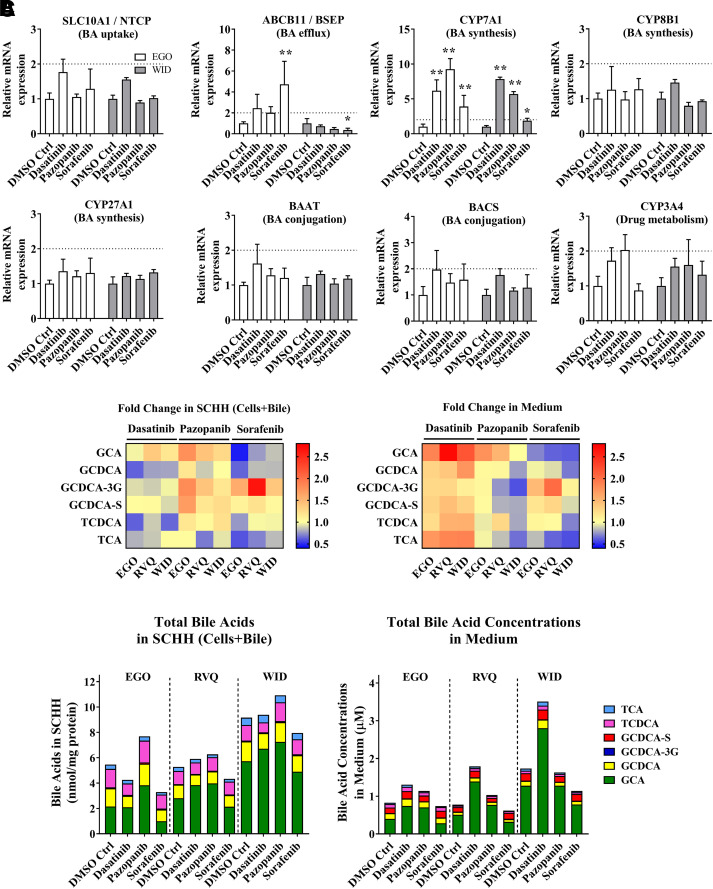
Gene expression analysis by RT-qPCR and quantitative analysis of bile acid concentrations in sandwich-cultured human hepatocytes (SCHH) treated with tyrosine kinase inhibitors (TKIs). (A) mRNA was measured in SCHH (lots EGO and WID) after an 8-hour incubation with 0.1% DMSO control (DMSO Ctrl), dasatinib (1.8 μM), pazopanib (6.6 μM), or sorafenib (4.3 μM). Threshold cycle (CT) values of each gene of interest (SLC10A1, ABCB11, CYP7A1, CYP8B1, CYP27A1, BAAT, BACS, and CYP3A4) were normalized to the housekeeping gene β-actin (ACTB) and compared with 0.1% DMSO control. Data are plotted as mean ± standard deviation (n = 3). Statistically significant differences were determined by a repeated measures two-way ANOVA with Dunnett’s multiple comparison test (*P value < 0.05, **<0.0001, TKI versus control). (B) Bile acid concentrations were quantified in SCHH (lots EGO, RVQ and WID) treated with 0.1% DMSO control, dasatinib (1.8 µM), pazopanib (6.6 µM) or sorafenib (4.3 µM) for 24 hours and in medium from each well using liquid chromatography with tandem mass spectrometry (LC-MS/MS). Bile acid concentrations in “Cells+Bile” were normalized to total protein. Average fold change (n = 3 or 4) of each bile acid species [glycocholic acid (GCA), glycochenodeoxycholic acid (GCDCA), GCDCA-3-O-β-glucuronide (GCDCA-3G), GCDCA 3-sulfate (GCDCA-S), taurochenodeoxycholic acid (TCDCA), and taurocholic acid (TCA)] was calculated, compared with 0.1% DMSO control in SCHH and medium, and plotted as a heat map (red = increase, blue = decrease). (C) Average total bile acid species in “Cells+Bile” and medium were plotted based on SCHH lot and treatment. BA, bile acids.

