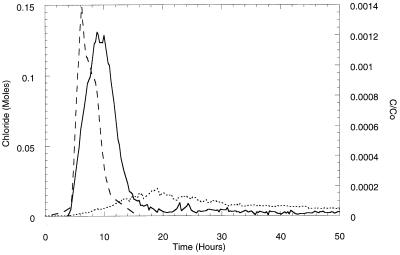
FIG. 5.
Effluent concentrations of chloride (---), ENV435 (—), and B. cepacia G4 (⋯) transported simultaneously through an intact core column containing Oyster site sediment. Bacterial concentrations are expressed as the concentration in the effluent (C) divided by the initial concentration injected (Co).

