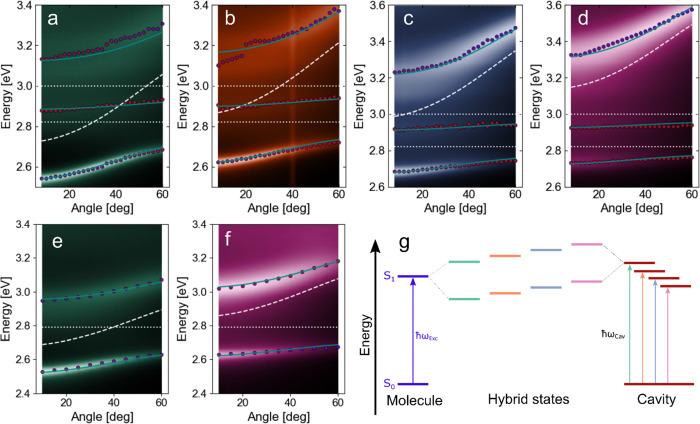
Figure 2.
Dispersion plots for the 1-ethyl-perylene cavities (a–d) and the DABNA-2 cavities (e, f) having different tuning. The dots represent the measured minima in the reflectivity, the teal line is the fit obtained by the coupled harmonic oscillator model, the white dashed line is the cavity resonance energy, and the white dotted lines are the molecular transition energies. (g) Energy sketch of the differently detuned cavities.

