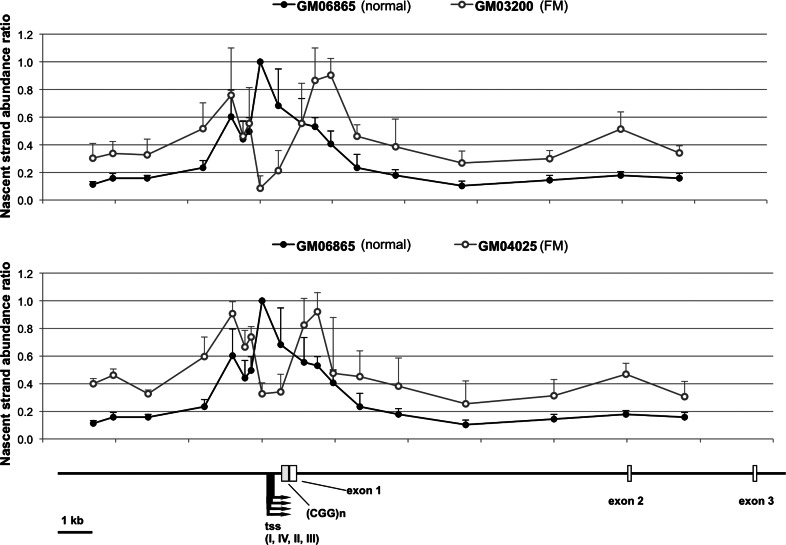
Figure 5.
Comparison of the nascent strand abundance profiles of a normal male (GM06865) and two carriers of methylated FMs (GM04025 and GM03200). The nascent strand abundance profiles were determined as described in the Materials and Methods. To facilitate comparison, the number of CGG-repeats, which varied among all three cell lines was not shown to scale, and the data points were expressed as a fraction of the highest peak in each dataset.

