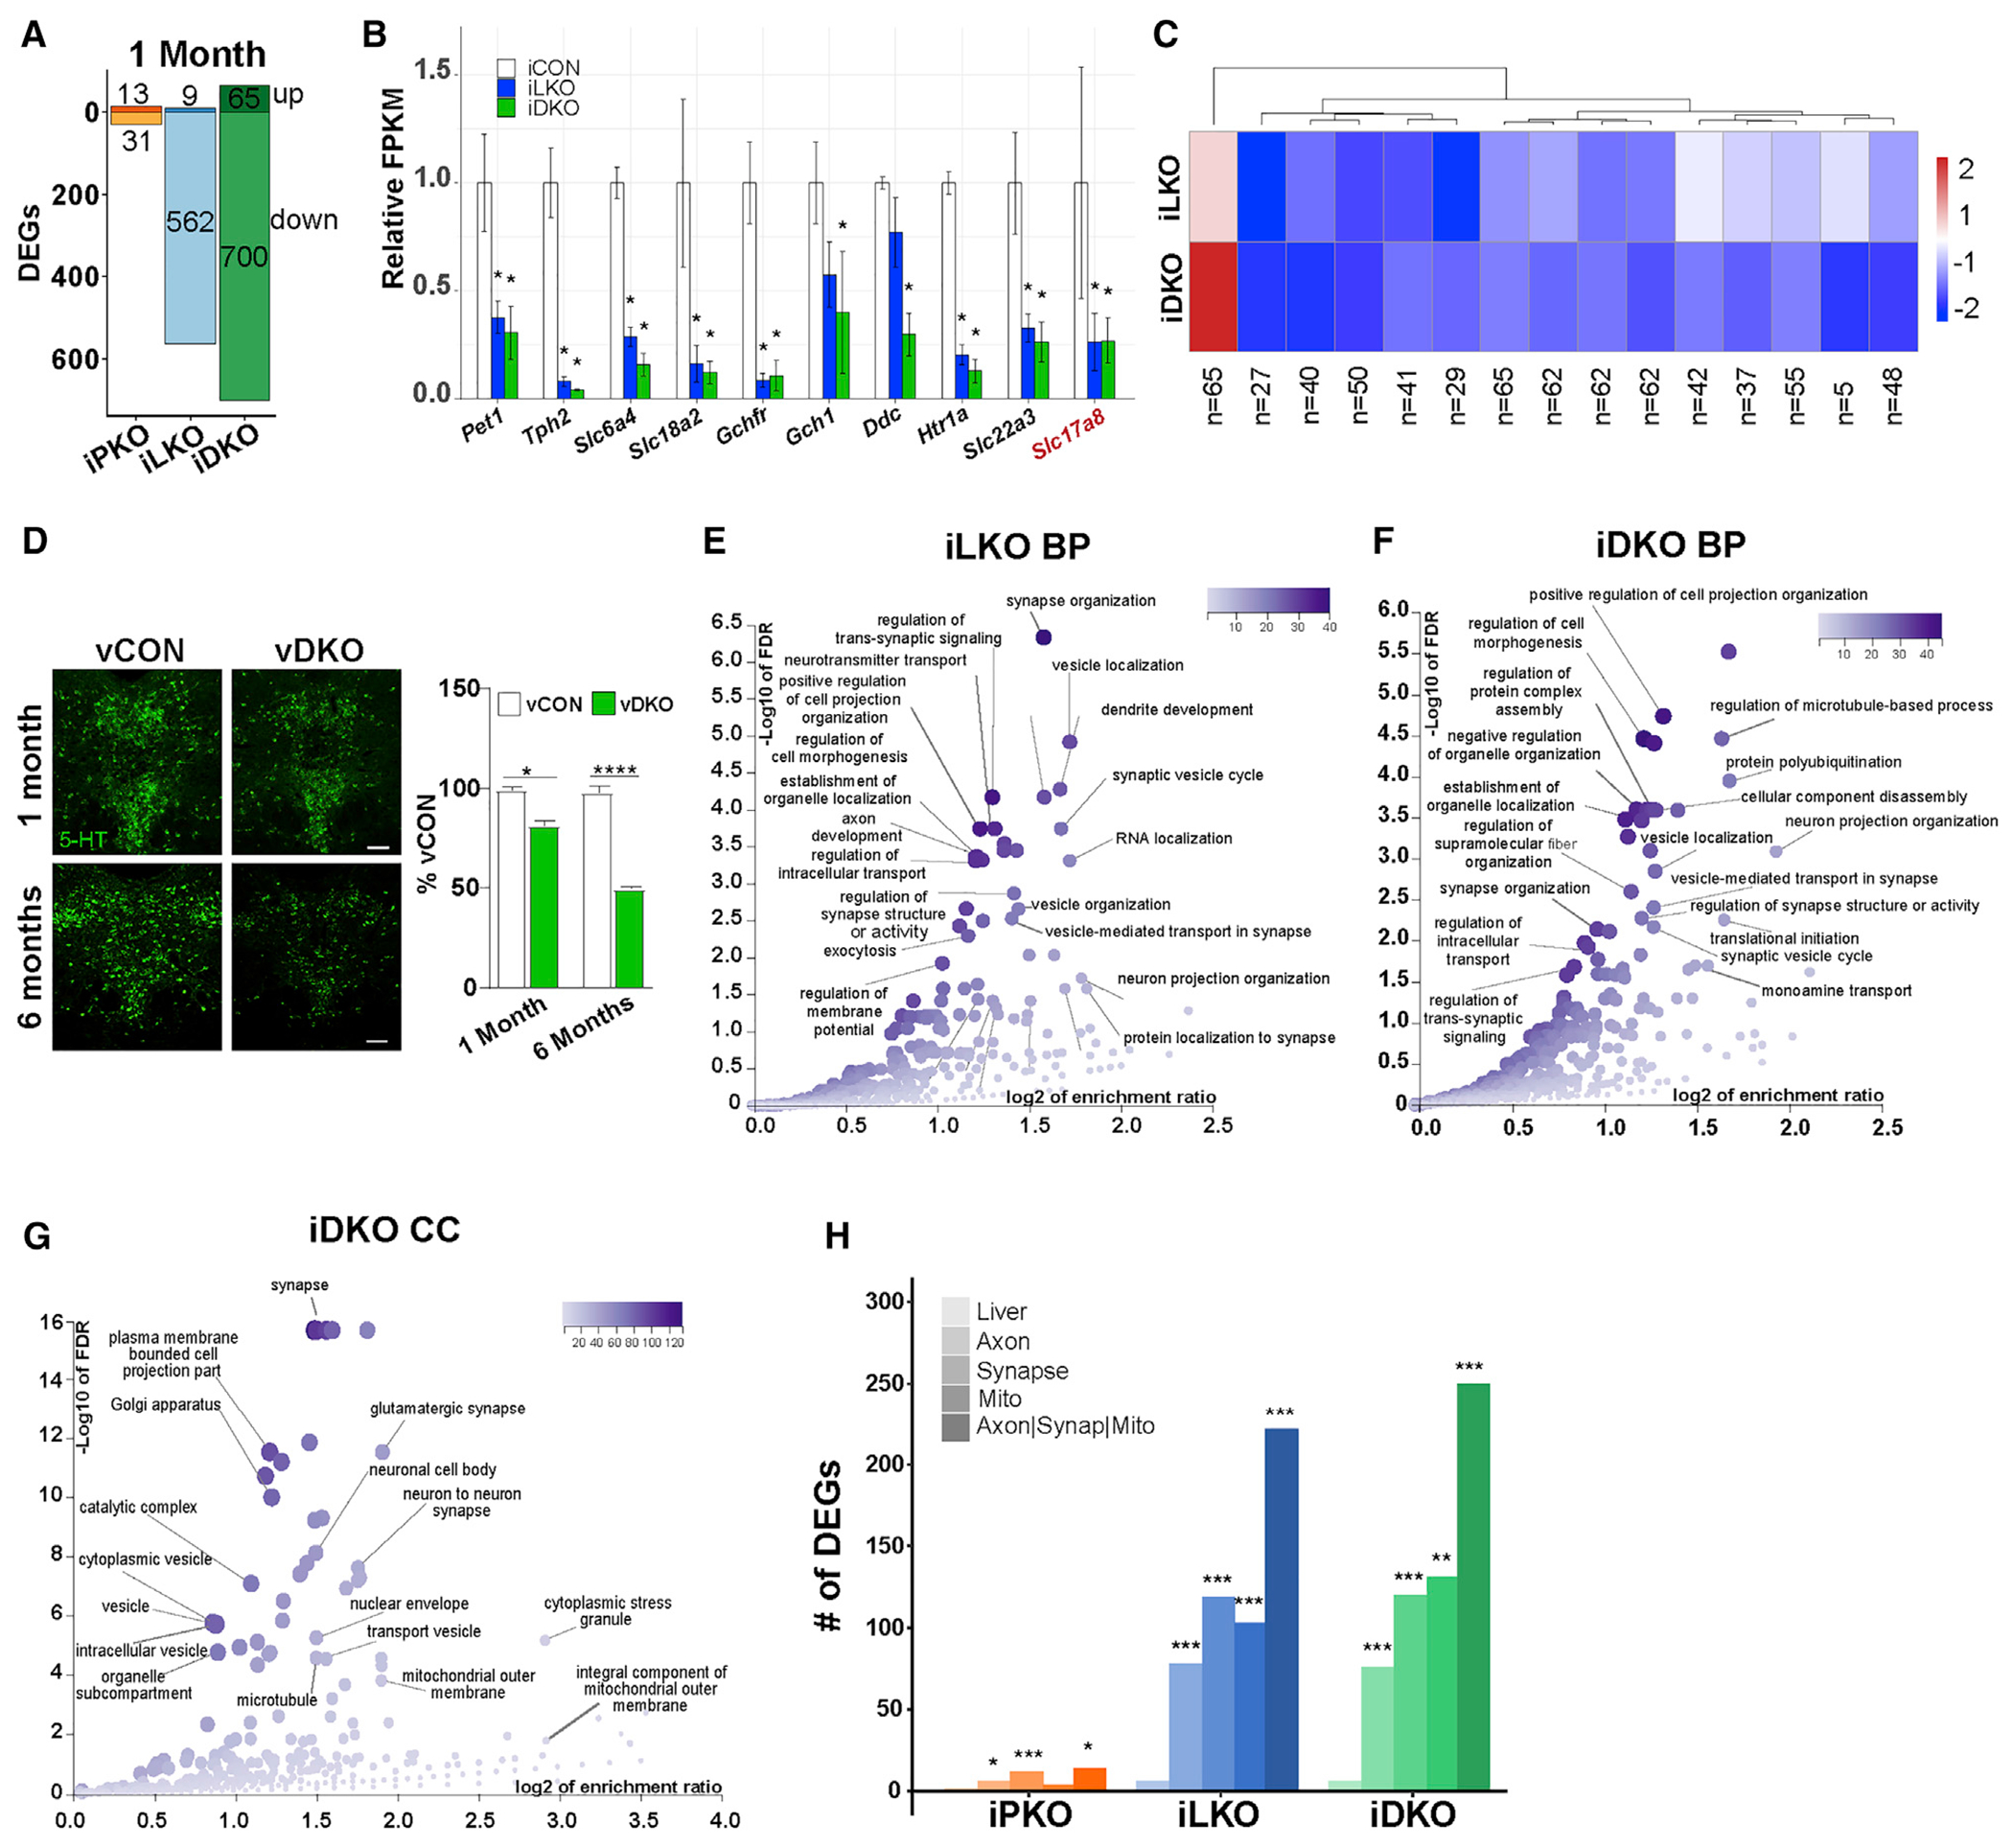
Figure 1. An adult-stage transcriptomic signature of 5-HT connectivity controlled by Lmx1b and Pet1.

(A) iPKO, iLKO, and iDKO DEGs at 1 month post-TAM; FDR ≤ 0.05. Up or down DEG numbers are indicated for each genotype.
(B) Relative expression levels of 5-HT and glutamatergic (Slc17a8) neurotransmission genes at 1 month post-TAM.
(C) Heatmap of 1 month post-TAM iDKO and iLKO DEG expression levels; k = 15, k-means clustering. Each box represents the scaled mean expression level of the group of genes for each cluster and genotype. The dendrogram indicates the degree of similarity between each k-means cluster. The number of genes in each cluster is shown below each cluster. Red and blue indicate up- and down-regulated direction, respectively.
(D) Representative 5-HT immunostaining 1 and 6 months after AAV-Cre injection; ±SEM; n = 1,000–1,500 neurons analyzed in three sections per animal per genotype; 1-way ANOVA. Scale bar, 100 μm.
(E and F) Biological process (BP) term enrichment of 1 month post-TAM iLKO (E) and iDKO (F) down DEGs.
(G) Cellular component (CC) term enrichment of 1 month post-TAM iDKO down DEGs.
(H) DEG counts for indicated GO terms. Hypergeometric test of DEG counts for each GO term versus counts of all protein-coding genes annotated with the GO term. *p < 0.05, **p < 0.01, ***p < 0.001, ****p < 0.0001. See also Figure S1.
