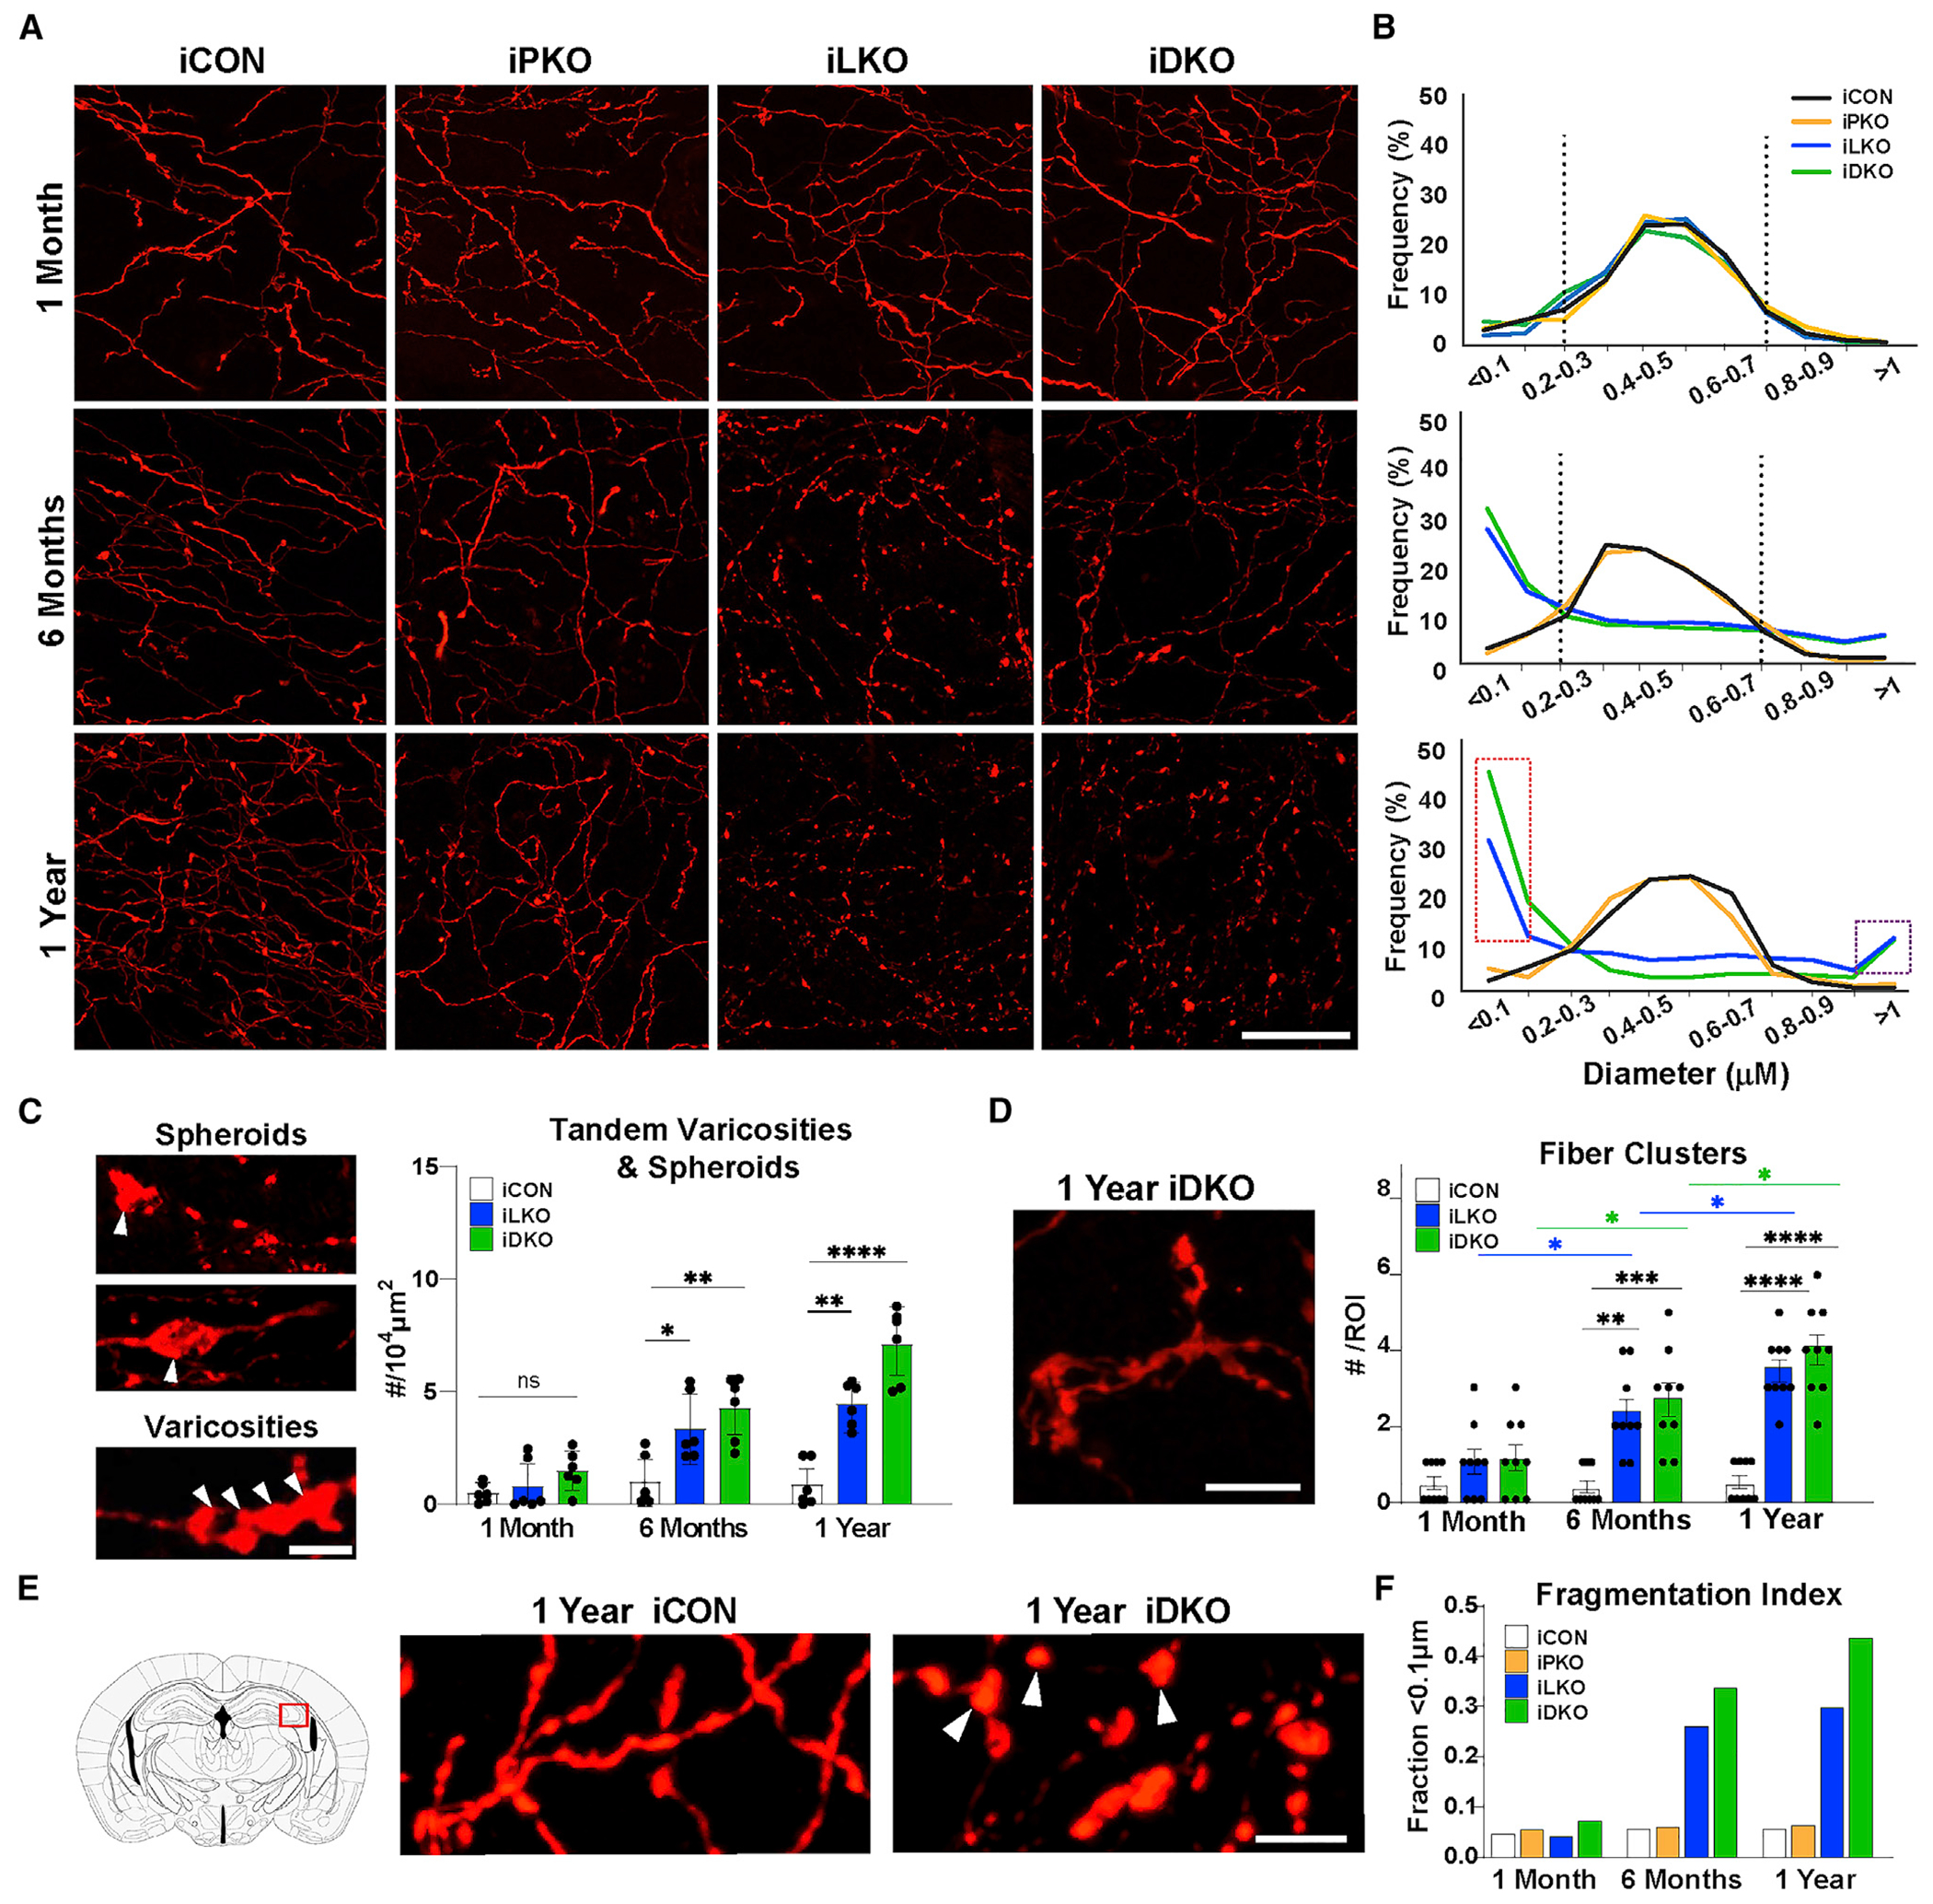
Figure 4. Adult-stage progressive axon fragmentation and spheroid formation.

(A) Representative images of TdTomato+ (anti-RFP) axons in hippocampal CA2. Scale bar, 20 μm.
(B) Imaris quantification of binned (0.1 μm) axon diameter frequencies. Vertical dotted lines mark peak frequencies of iCON axon diameters. Dotted red rectangle highlights increased frequency of smaller fiber diameters in iLKO and iDKO. Dotted purple rectangle highlights increased frequency of large-diameter elements in iLKO and iDKO designated as swollen varicosities and spheroids; n = 2 images (63×) from two mice per genotype.
(C) Left, representative images of spheroids (arrowheads, top) and tandem swollen varicosities (arrowheads, bottom) in iDKO axons. Right, quantification of tandem swollen varicosities and spheroid numbers at indicated times post-TAM: ±SEM; n = 3 mice pergenotype. Two sections per animal were analyzed; one-way ANOVA at each time point.
(D) Left, representative image of abnormal fibers clusters in iDKO mice. Right, quantification of cluster numbers: ±SEM; n = 3 mice per genotype. Three sections per animal were analyzed; two-way ANOVA.
(E) High magnification image of iCON versus iDKO axons highlighting isolated swollen varicosities (arrowheads) in iDKO hippocampal CA2.
(F) Fragmentation index based on proportion of fiber diameters below the detection limit of <0.1 μm. (n = 2 mice per genotype with two images (63×) from each animal). *p < 0.05, **p < 0.01, ***p < 0.001, ****p < 0.0001; ns, not significant. Scale bars, 5 μm. See also Figures S4–S7.
