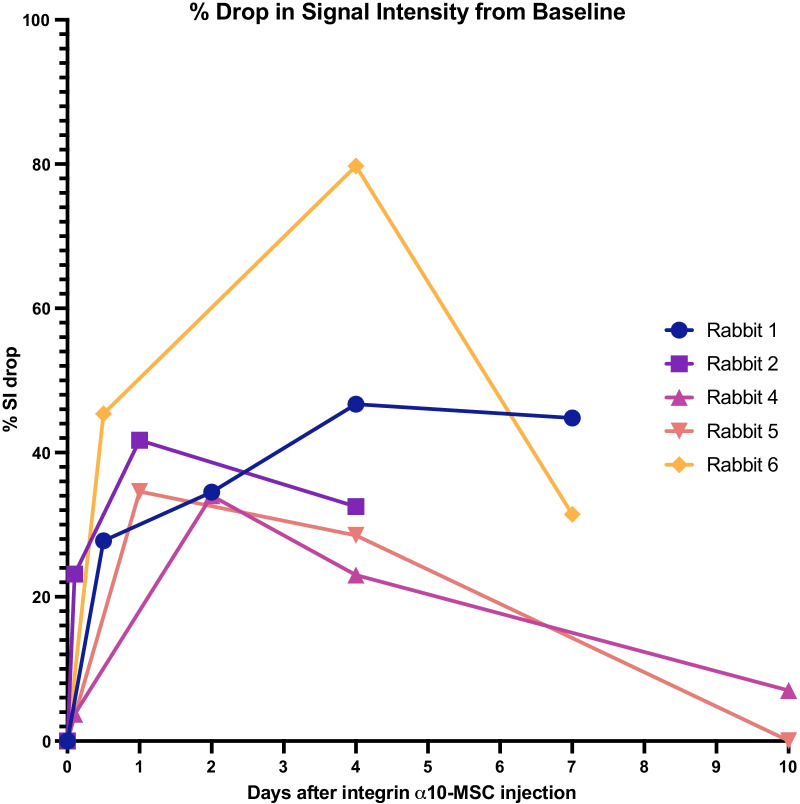
Fig. 7.
Magnetic resonance imaging (MRI) signal intensity (SI) in the cartilage defects after homing of labeled integrin α10-MSCs. All images of the same rabbit were aligned. A 3D region of interest (ROI) was marked in the area of the cartilage defect (indicated in Fig. 6) and SI in the ROI was automatically calculated. The graph shows the % drop in SI from baseline. An SI drop indicates accumulation of labeled α10-MSCs in the defect. The SI drop was statistically significant on day 4 (p = 0.036) relative to baseline. Note that rabbit #3 was removed from the study because of unintentional peri-articular injection of labeled α10-MSCs

