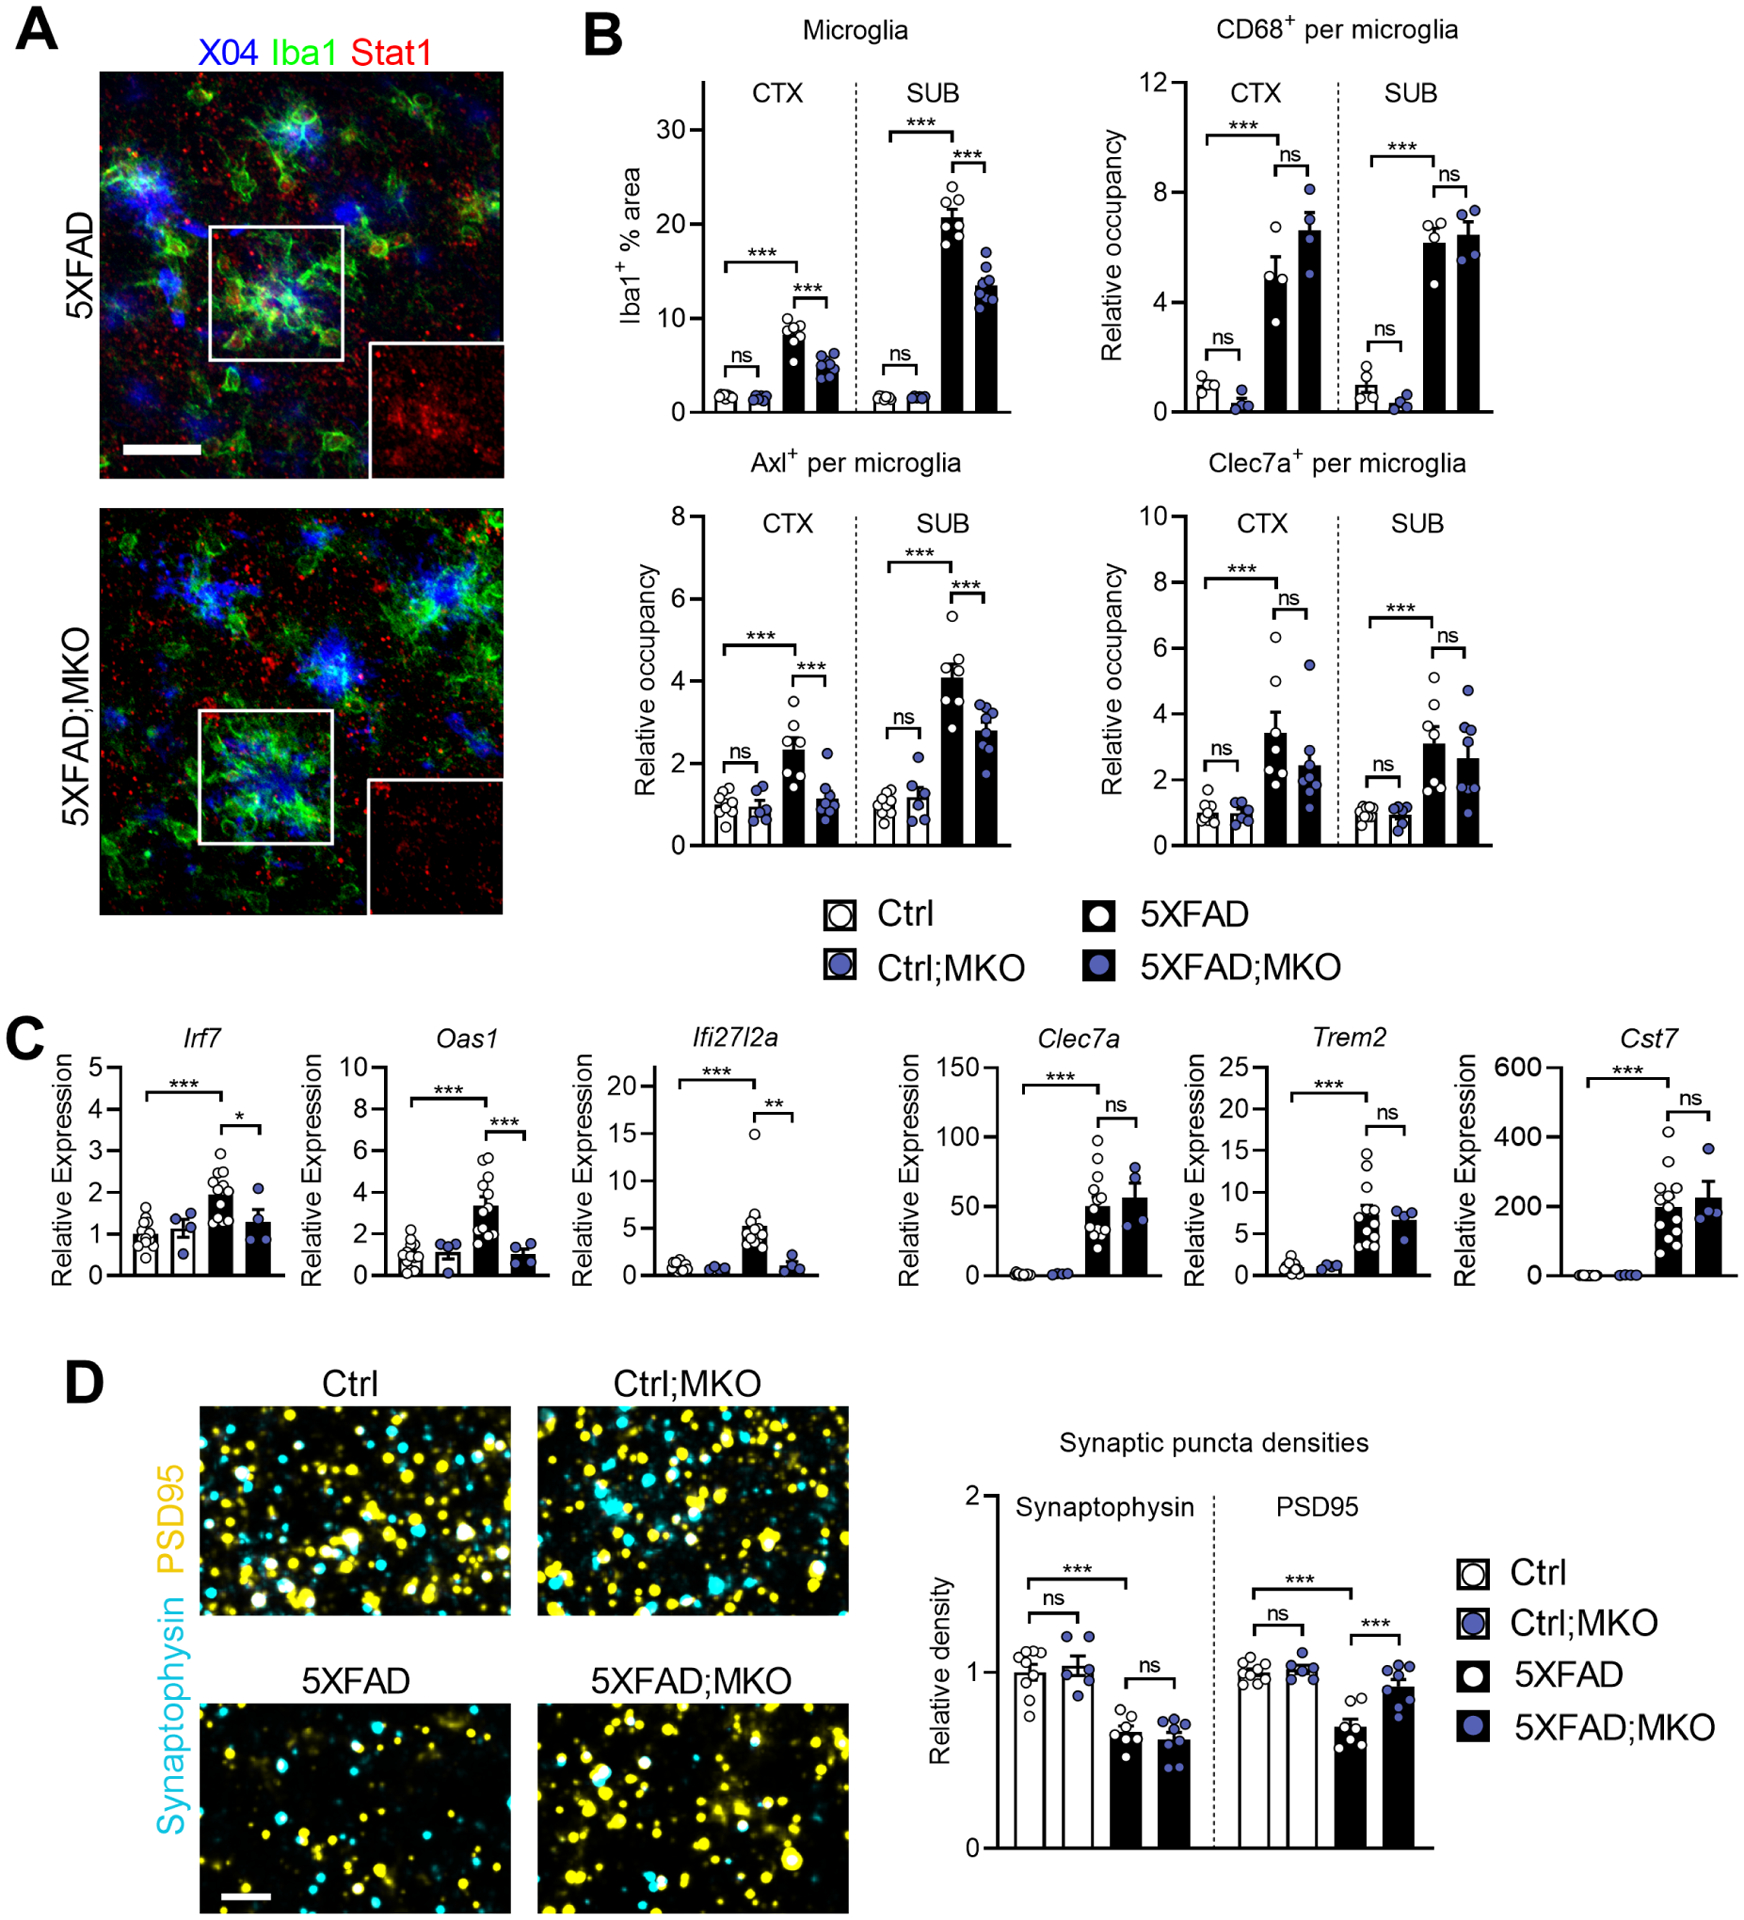
Figure 4: Selective microglial Ifnar1 ablation decreases microglial reactivity and rescues post-synaptic loss.

A, Representative images of Stat1 expression in subicula of 5XFAD;MKO mice (n = 8 mice) compared to Ifnar1-sufficient 5XFAD mice (n = 7 mice). Insets show isolated Stat1 channel of boxed areas. Z-stack projections; scale bar, 30 μm.
B, Quantifications of total % Iba1+ area and activation marker occupancy by region. For Iba1, Axl, and Clec7a: Ctrl, n = 9 mice; Ctrl;MKO, n = 6 mice; 5XFAD, n = 7 mice; 5XFAD;MKO, n = 8 mice. For Cd68: n = 4 mice per genotype.
C, Relative expression of ISGs and microglial activation markers analyzed by qPCR on bulk hippocampal tissues. Ctrl, n = 13 mice; Ctrl;MKO, n = 4 mice; 5XFAD, n = 12 mice; 5XFAD;MKO, n = 4 mice.
D, High-magnification confocal images of pre- and post-synaptic puncta (synaptophysin and PSD95, respectively) in subiculum. Z-stack projections of 2 μm thickness; scale bar, 3 μm. Quantification of relative synaptic puncta densities. Ctrl, n = 9 mice; Ctrl;MKO, n = 6 mice; 5XFAD, n = 7 mice; 5XFAD;MKO, n = 8 mice.
All: Data represent means and s.e.m. Differences between groups were analyzed by ordinary one-way ANOVA and Bonferroni’s multiple-comparisons tests. ns, not significant; *P < 0.05; **P <0.01; ***P < 0.001. Brain tissues were collected over time, combined and analyzed in parallel as part of one experiment, and images are representative. See also Figure S4 for additional analysis relating to this figure.
