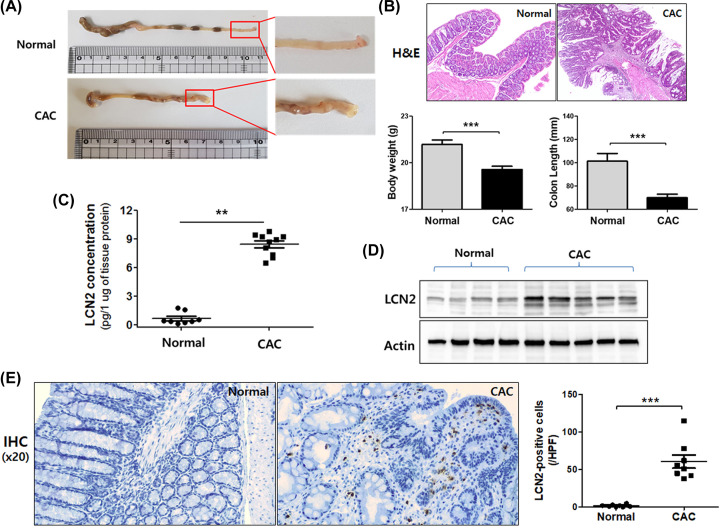
Figure 1. The expression of LCN2 was specifically induced in colon tissue of AOM/DSS-induced CAC mouse models.
The mice were given 7.4 mg/kg body weight of AOM and 3% DSS and subsequently killed (normal = 10, AOM/DSS = 12 mice). (A) Macroscopic appearance was captured for detecting tumor formation in the colon. (B) H&E staining (magnification ×10) of colonic mucosal tissue sections from mice were photographed using microscopy (upper panel). Colon length and body weight were statistically analyzed (lower panel). Data shown are presented as the mean ± SE. **P<0.01 versus control and CAC group. (C) After homogenizing colonic tissues, levels of LCN2 in tissue were detected by ELISA as described in the ‘Materials and methods’ section. Data shown are presented as the mean ± SE. **P<0.01 versus the control and CAC groups. (D) Total tissue extracts were prepared after killing and analyzed using LCN2 and actin antibody by Western blotting. Actin was used as a loading control. (E) IHC images of LCN2 expression in the colonic tissues from control and CAC mice are shown and the positively binding cells are shown in brown. The numbers of positive cells in the tumor samples were counted. Values represent means ± SEs. ***P<0.001 vs. the normal group.

