
Figure 5.
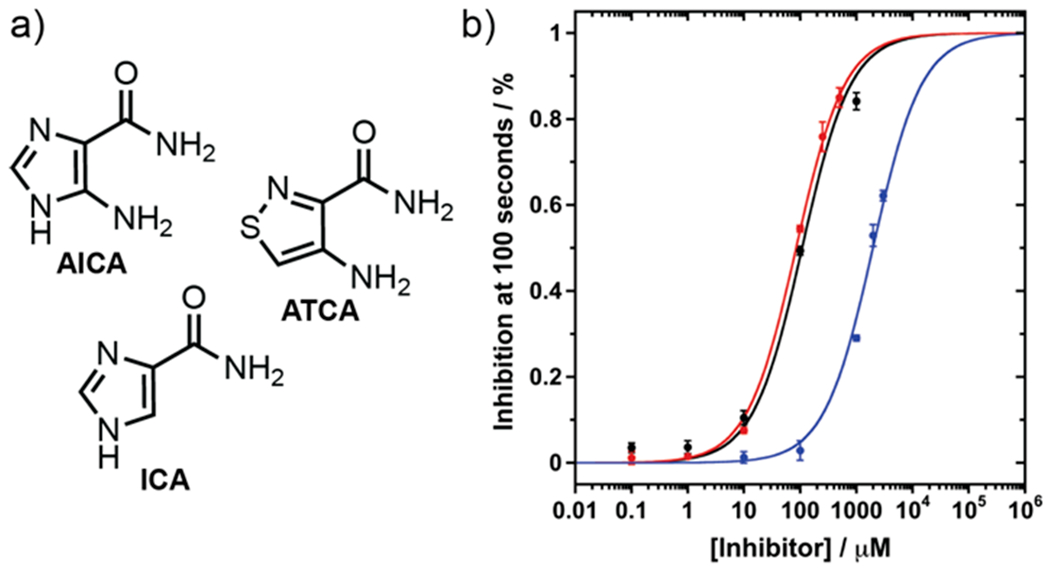
a) GDA inhibitor structures of AICA, ATCA, and ICA. b) Overlay of % inhibition at 100 s and sigmoidal Hill plot for AICA (black), ATCA (red), and ICA (blue).
Official websites use .gov
A
.gov website belongs to an official
government organization in the United States.
Secure .gov websites use HTTPS
A lock (
) or https:// means you've safely
connected to the .gov website. Share sensitive
information only on official, secure websites.
a) GDA inhibitor structures of AICA, ATCA, and ICA. b) Overlay of % inhibition at 100 s and sigmoidal Hill plot for AICA (black), ATCA (red), and ICA (blue).