
Figure 3. Transcriptome analysis of the remnant kidney.
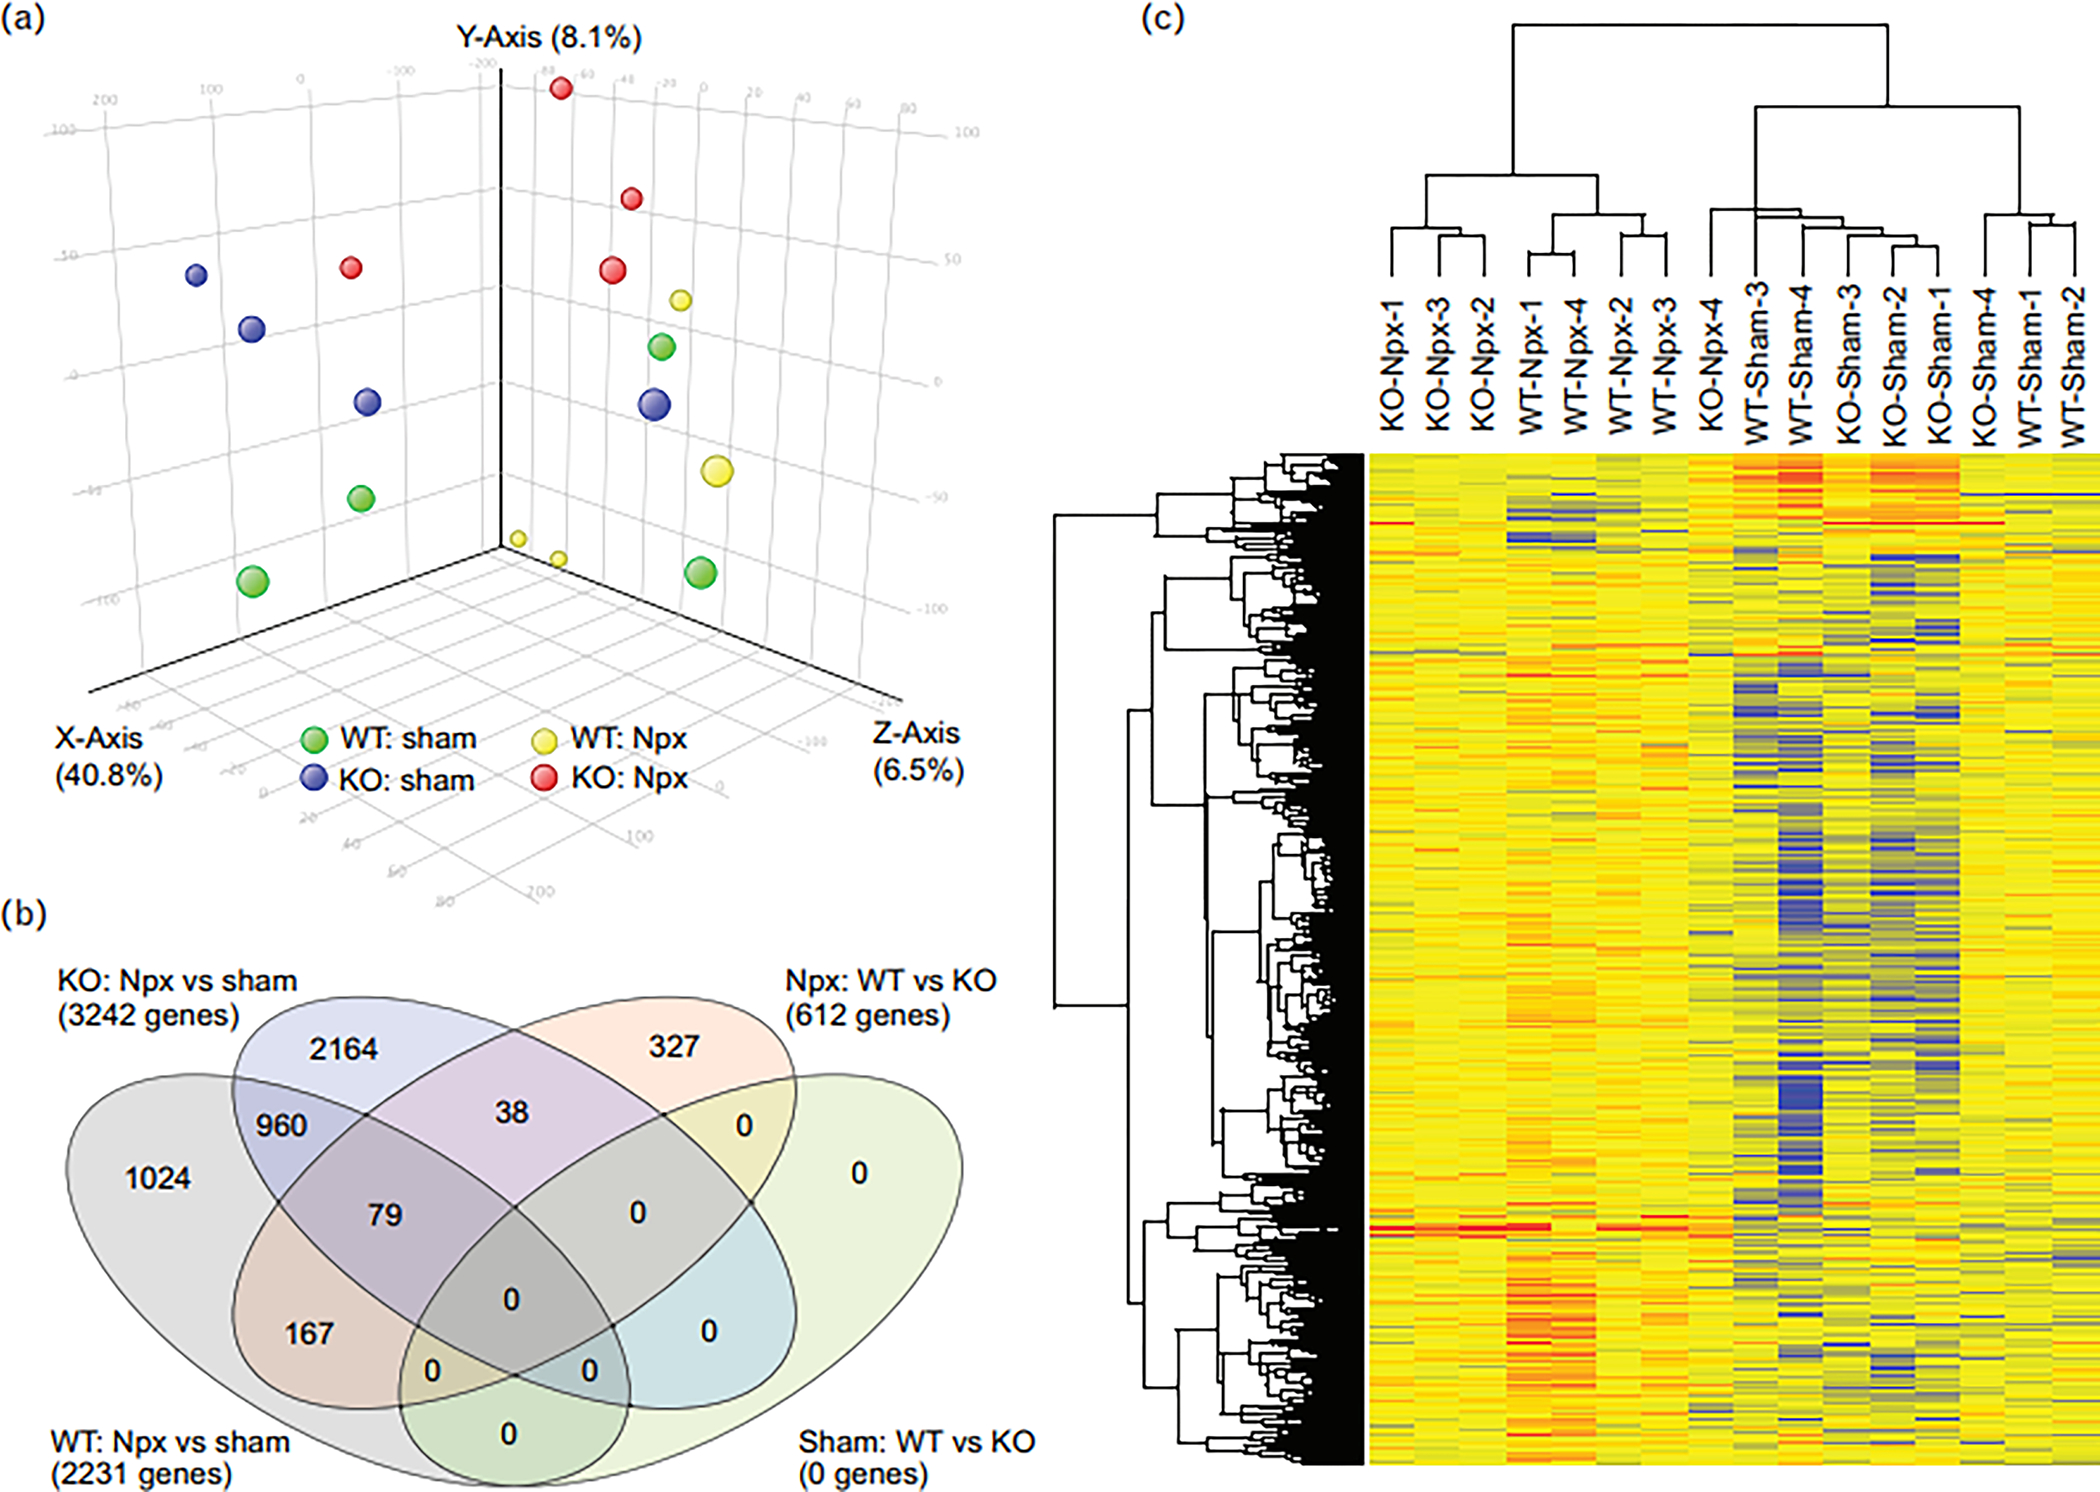
(A) PCA plot of the kidney tissue of mice subjected to sham and Npx surgery. (B) Venn diagram showing the number of genes altered by Npx in WT or KO mice, as well as the genes altered by genotype in sham or Npx mice. (C) The heatmap depicts all the altered genes. All the sham samples cluster together, as do most Npx samples.