
Figure 4. Differential expression of genes by strains in response to nephrectomy.
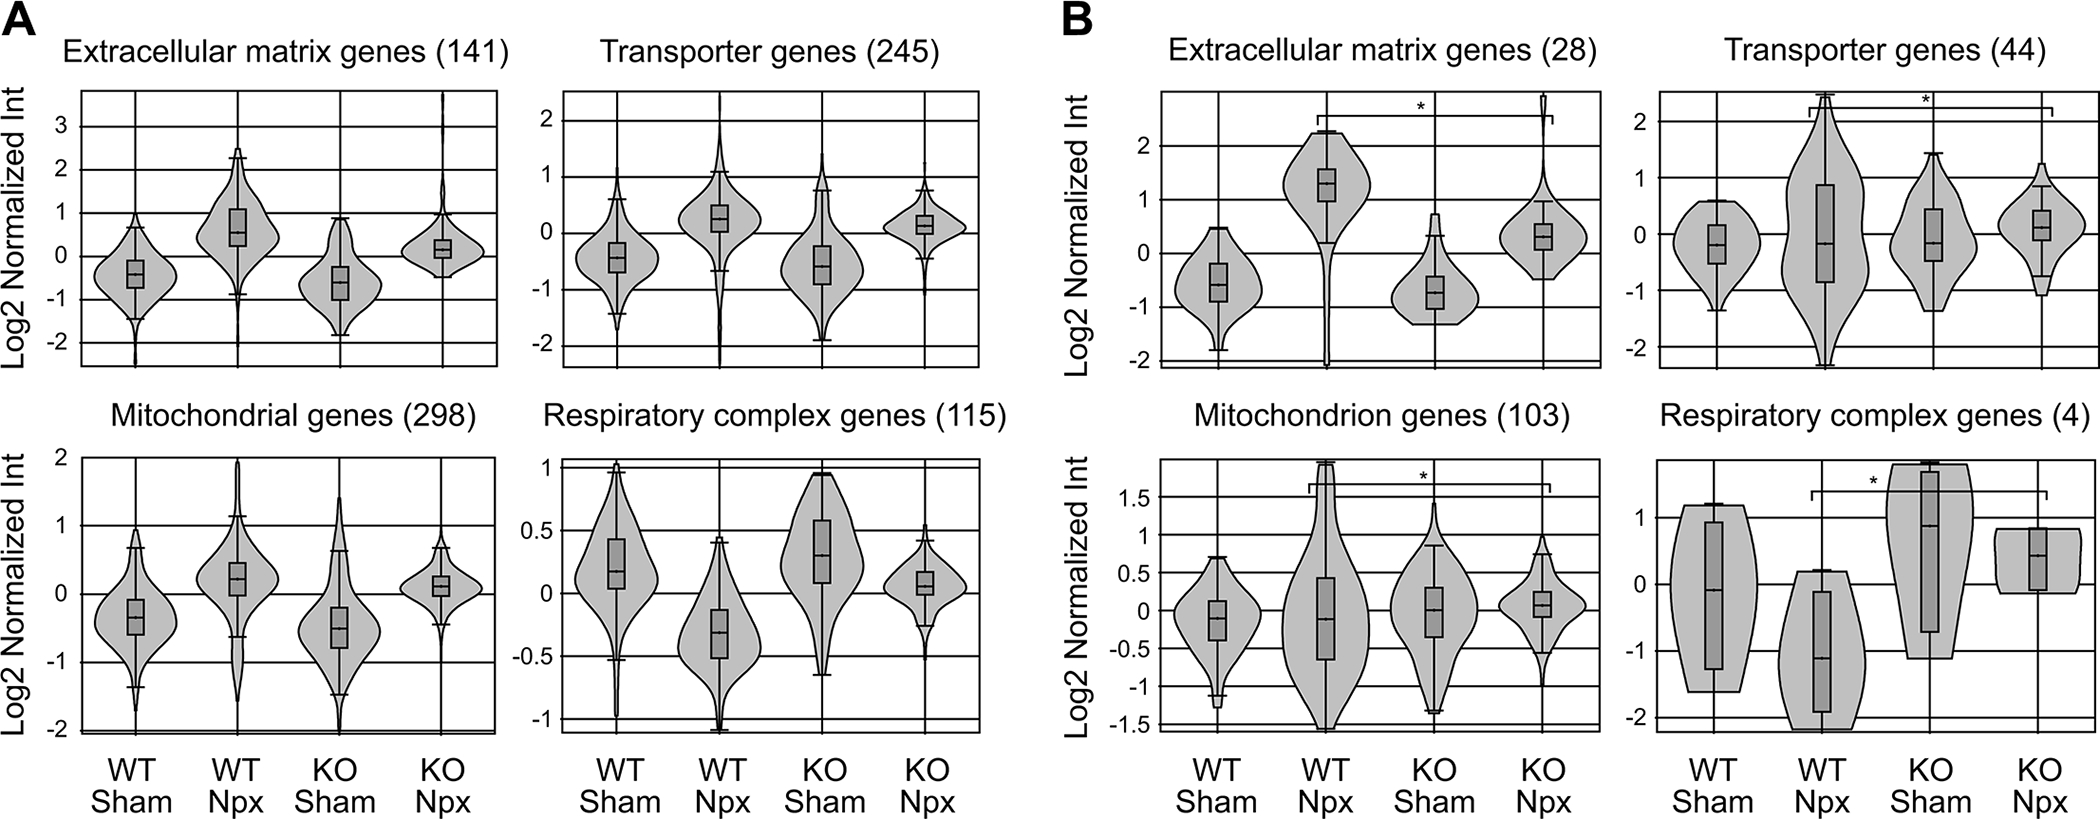
(A) Transcriptome analysis of ECM, transport, and mitochondrial gene families significantly altered in the complete dataset shown as violin plots. Most were up due to Npx in both WT and KO strains. The plot showing electron transport chain and ATP synthase genes were down in WT-Npx but not KO-Npx suggesting reduced mitochondrial efficiency in WT-Npx but somehow protected mitochondrial function in KO-Npx. (B) Gene families differentially expressed between WT-Npx and KO-Npx. There was no difference between WT and KO mice in the sham state. Expression of ECM genes were higher in WT than KO. Expression of transporter and mitochondrial genes showed greater variance in WT-Npx. Respiratory complex genes were downregulated in WT-Npx vs KO-Npx similar to D, again suggesting impaired mitochondria in WT-Npx.