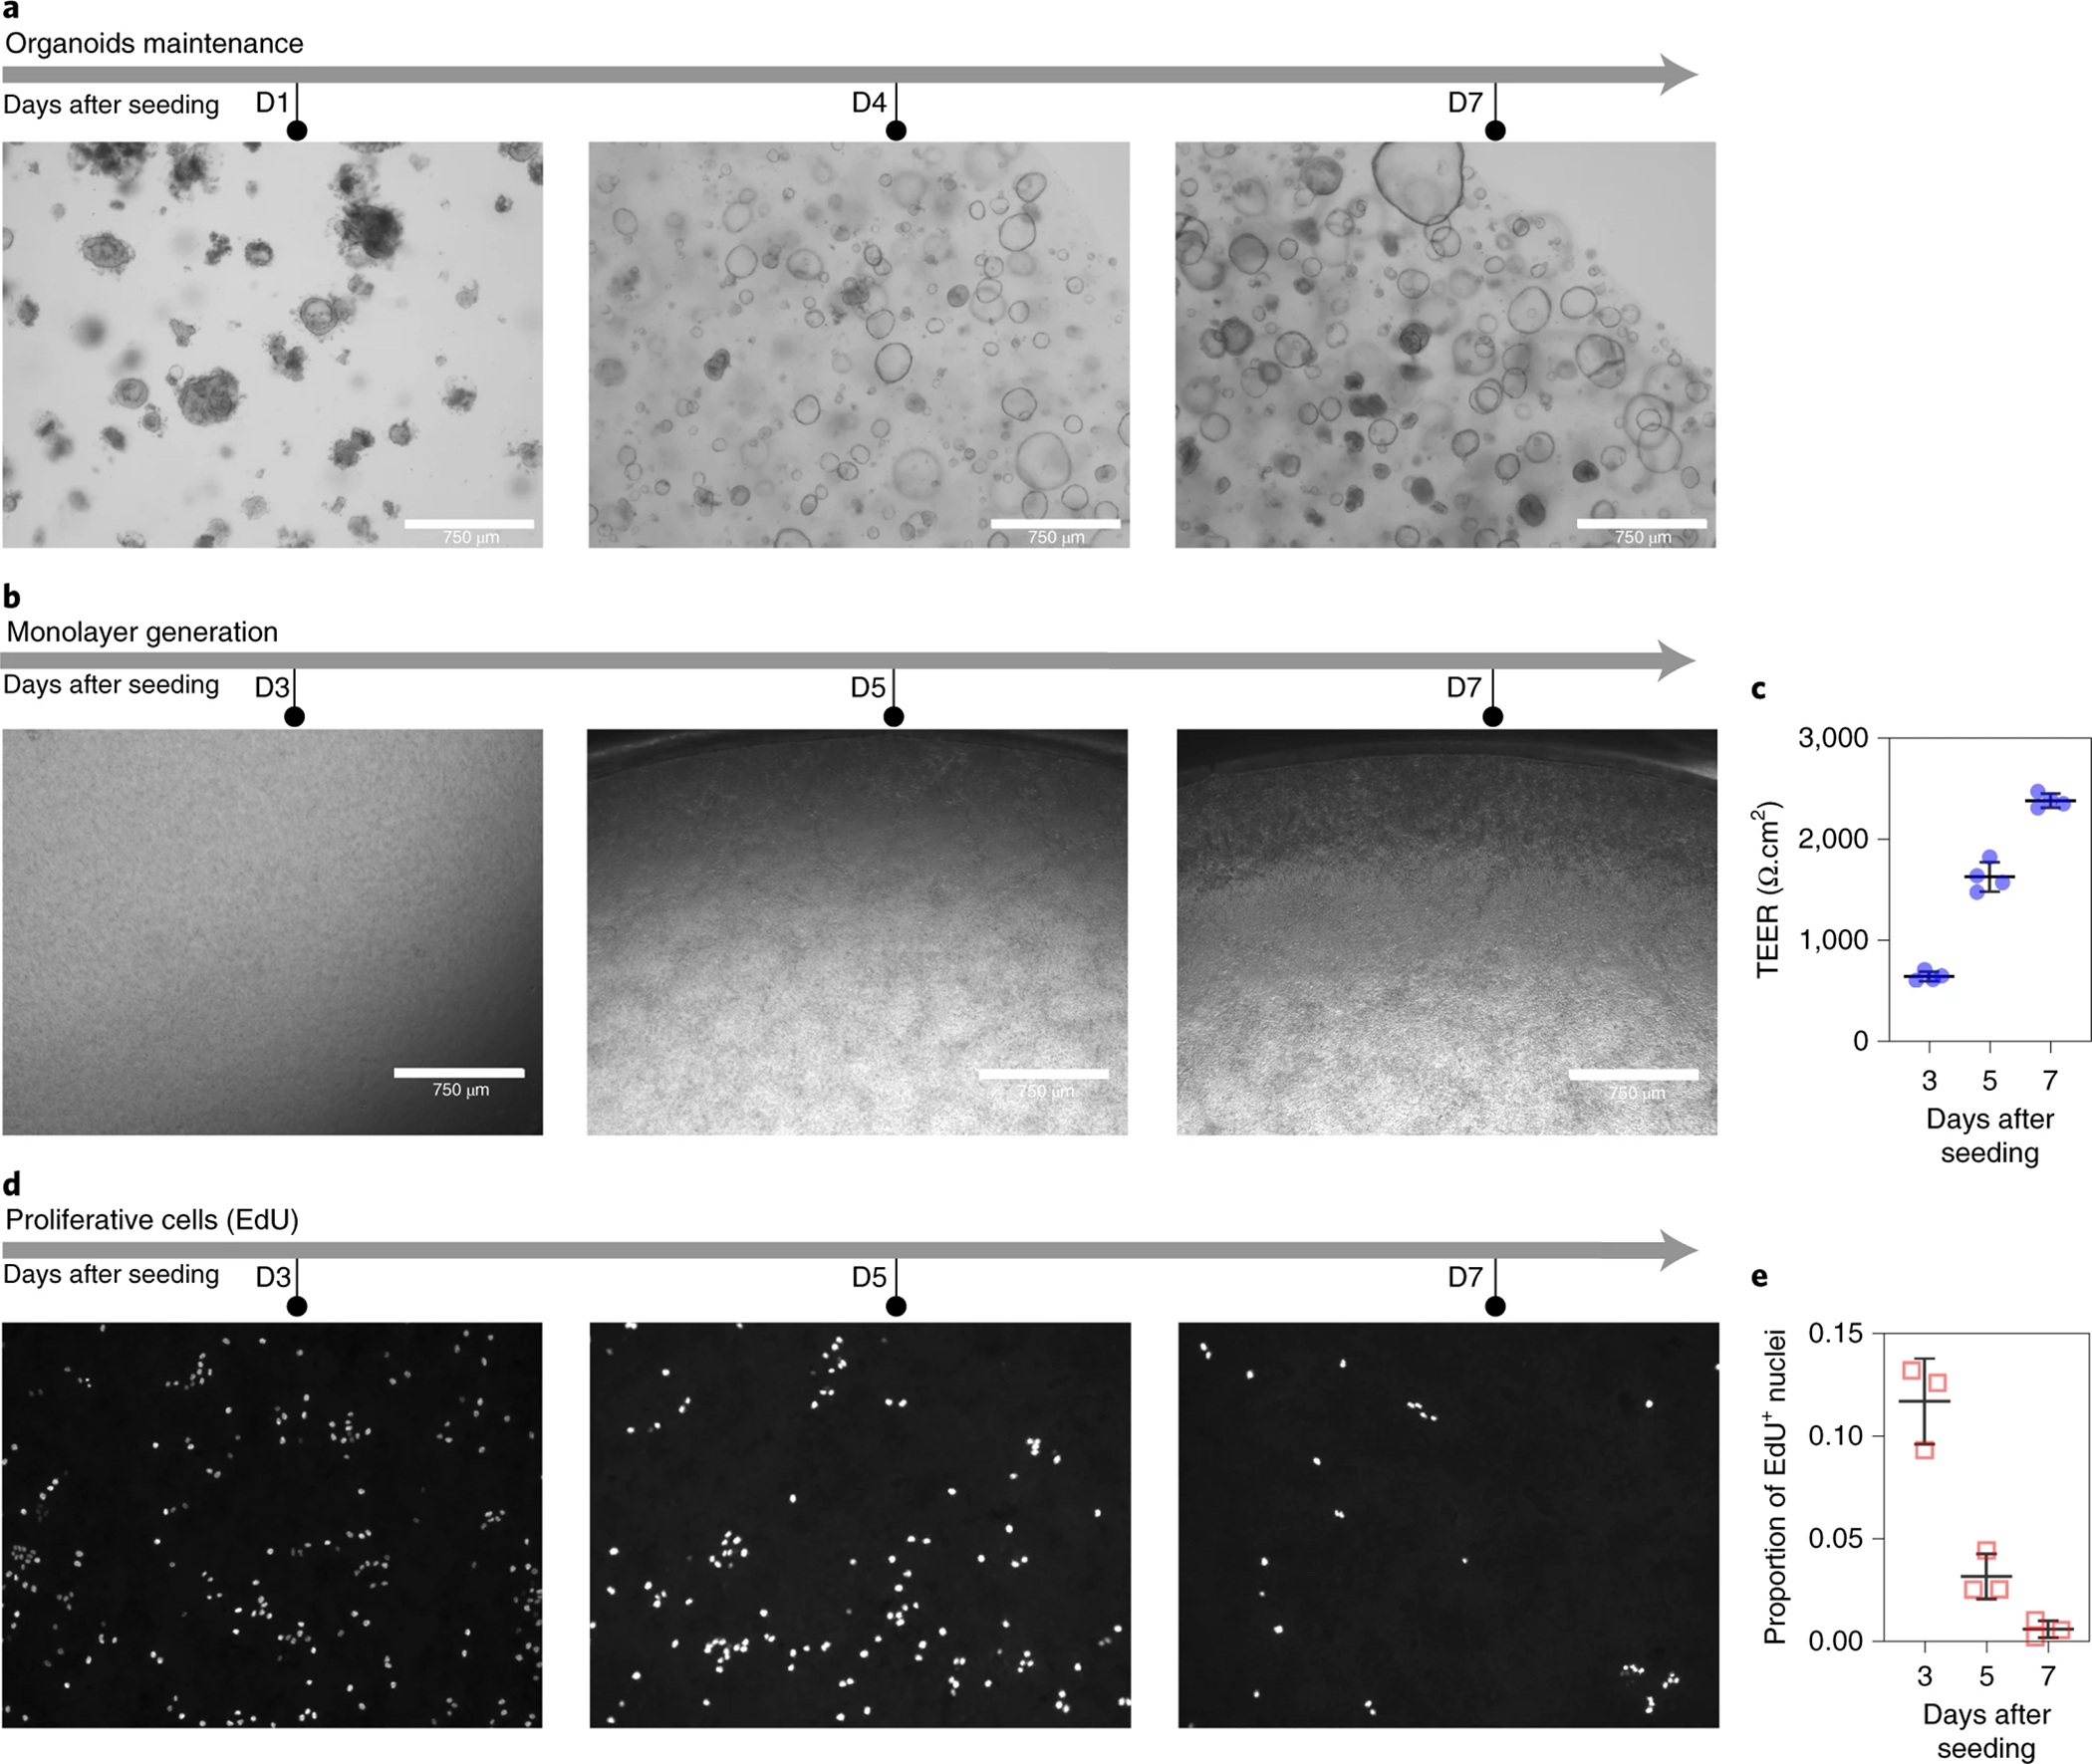
Figure 6. Representative images of organoids, monolayers and proliferative cells in those monolayers.

(a) Time course organoid growth at days one (D1), four (D4), and seven (D7) in Matrigel. (b) Bright field images of colon monolayers after three (D3), five (D5), and seven (D7) days post seeding. (c) Transepithelial electrical resistance (TEER) of monolayers at three (D3), five (D5), and seven (D7) days post seeding (n=4). Source Data Figure 6. (d) EdU staining of the cells in monolayer at three (D3), five (D5), and seven (D7) days post seeding. (e) The decrease in the proportion of EdU-positive cells 1316 upon differentiation, suggest a decrease of proliferative cells (n = 3). Source Data Figure 6. Data in (c) 1317 and (e) are presented as mean and standard deviation.
