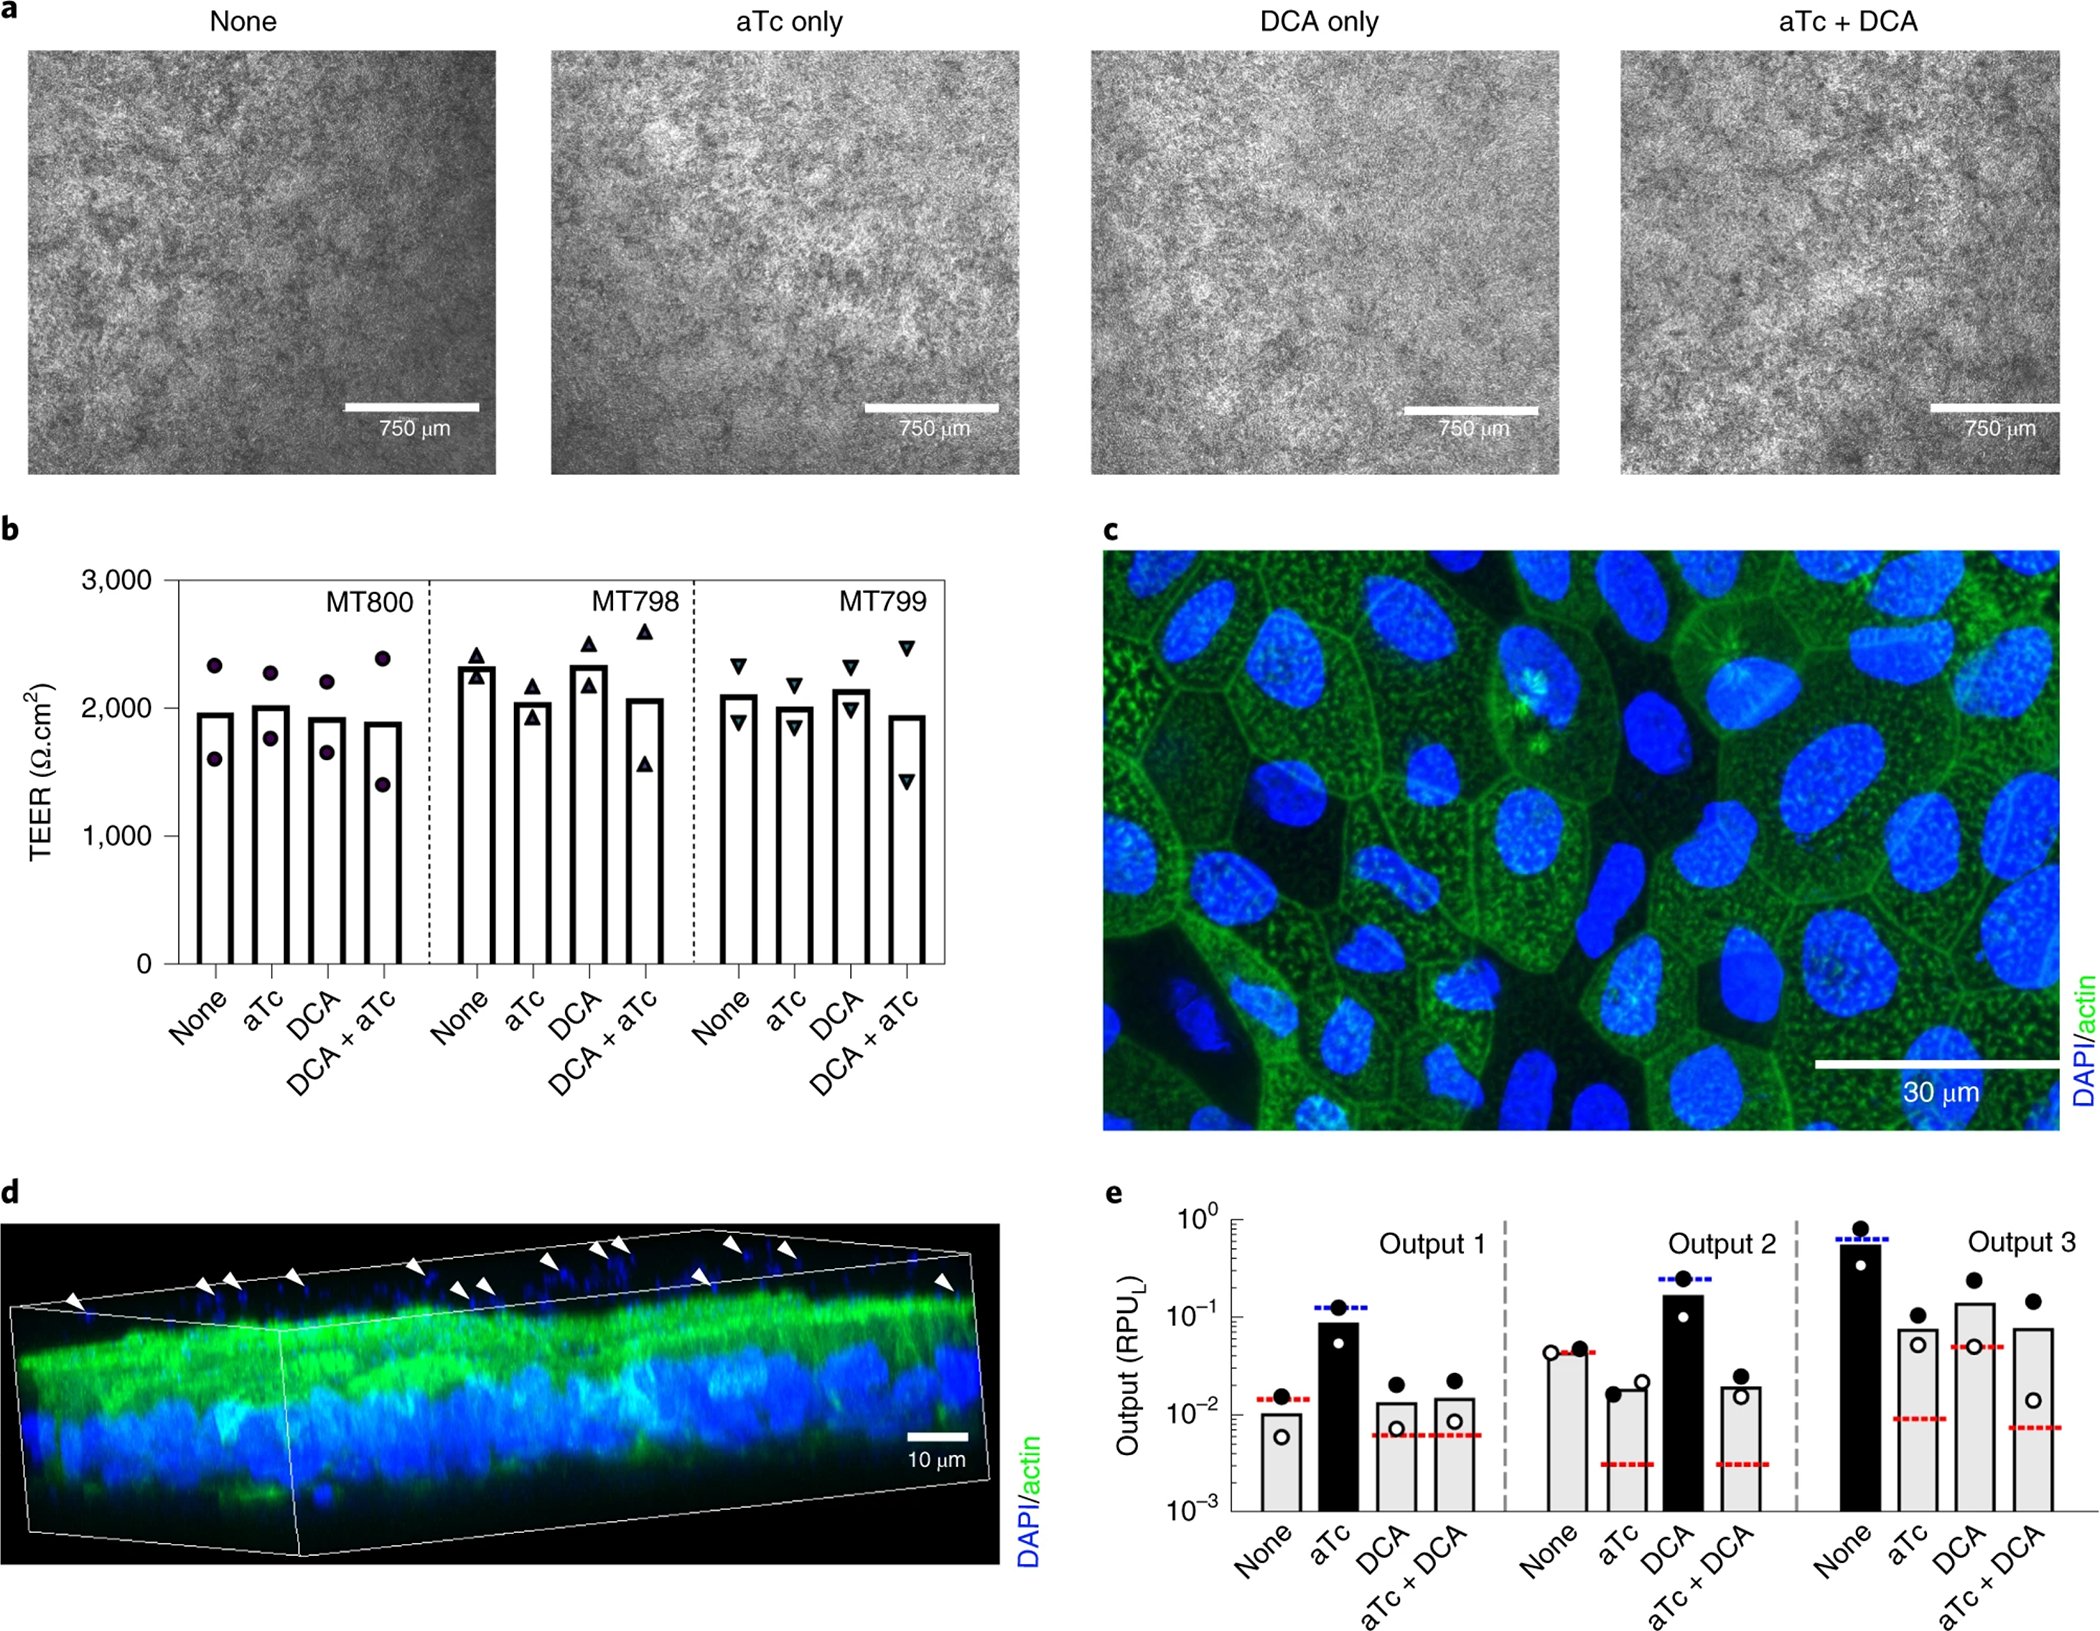
Figure 7. Evaluation on the integrity of monolayers and response of B. thetaiotaomicron to inducers 1320 after co-culture.

(a) representative brightfield images of monolayers after 8 h co-culture with B. thetaiotaomicron MT798 with inclusion of indicated inducers for the last 6 h of culture. Scale bar = 750μm. (b) TEER values of the monolayers co-cultured with B. thetaiotaomicron MT800 (circle), MT798 (upward triangle), and MT799 (downward triangle) at four different conditions (n=2), corresponding to the outputs in (e). Two independent experiments are depicted in the plot. Raw data can be found in Source Data Figure 7. (c) Epithelial cells in the monolayer with nuclear (blue) and beta-actin (green) staining. Scale bar =30 μm. (d) Three-dimensional rendering of the monolayer stained with DAPI (blue) and beta-actin (green), bacteria is present above the green actin layer of epithelial cells (see white arrows). Note that the scale bar in 3D rendered image is an approximation of the precise scale. (e) Luminescent output of B. thetaiotaomicron MT800 (Output 1), MT798 (Output 2), and MT799 (Output 3) in response to four different conditions (n=2). Dots indicate the values from two independent experiments. Figure 7b, 7d, and 7e were published previously.10 Raw data and the calculation of RPUL can be found in Supplementary Table S3.
