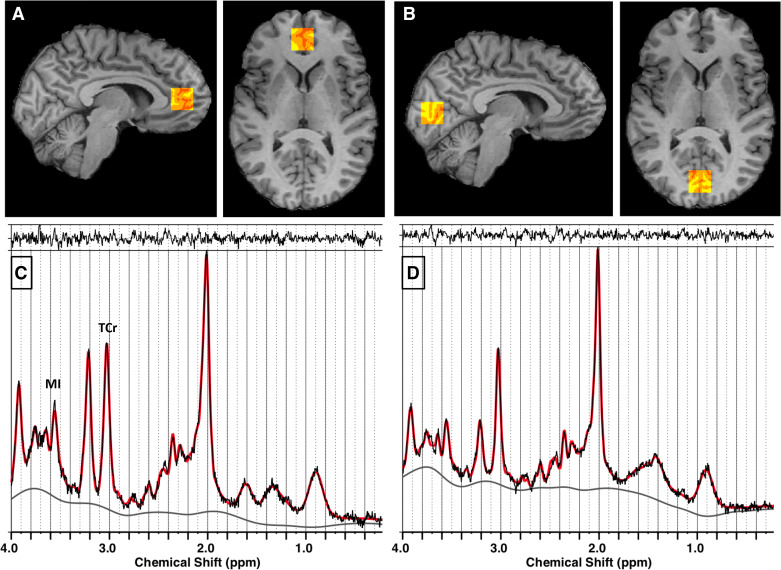
Figure 2.
Localization of voxels and LCModel spectral analyses for magnetic resonance spectroscopy (MRS) in pregenual anterior cingulate cortex (pgACC; A and C) and occipital cortex (OCC; B and D). A and B: red-yellow scale boxes overlaid on a participant’s T1-weighted image in gray scale on sagittal (left) and axial (right) slices show the voxel regions where MRS data were acquired. The colors show the results of the brain tissue segmentation inside the voxel as follows: red, cerebrospinal fluid; orange, gray matter; yellow, white matter. A: pgACC. B: OCC. C and D: MRS analyzed using LCModel—In vivo point resolved spectroscopy (PRESS) spectral data are shown in black, LCModel fit shown in red. The top margin shows the residual to the fit, the bottom gray line is the spectral baseline fit. MRS from pgACC (C) and MRS from OCC (D). MI, myoinositol; TCr, total creatine (creatine + phosphocreatine).

