
Figure 1.
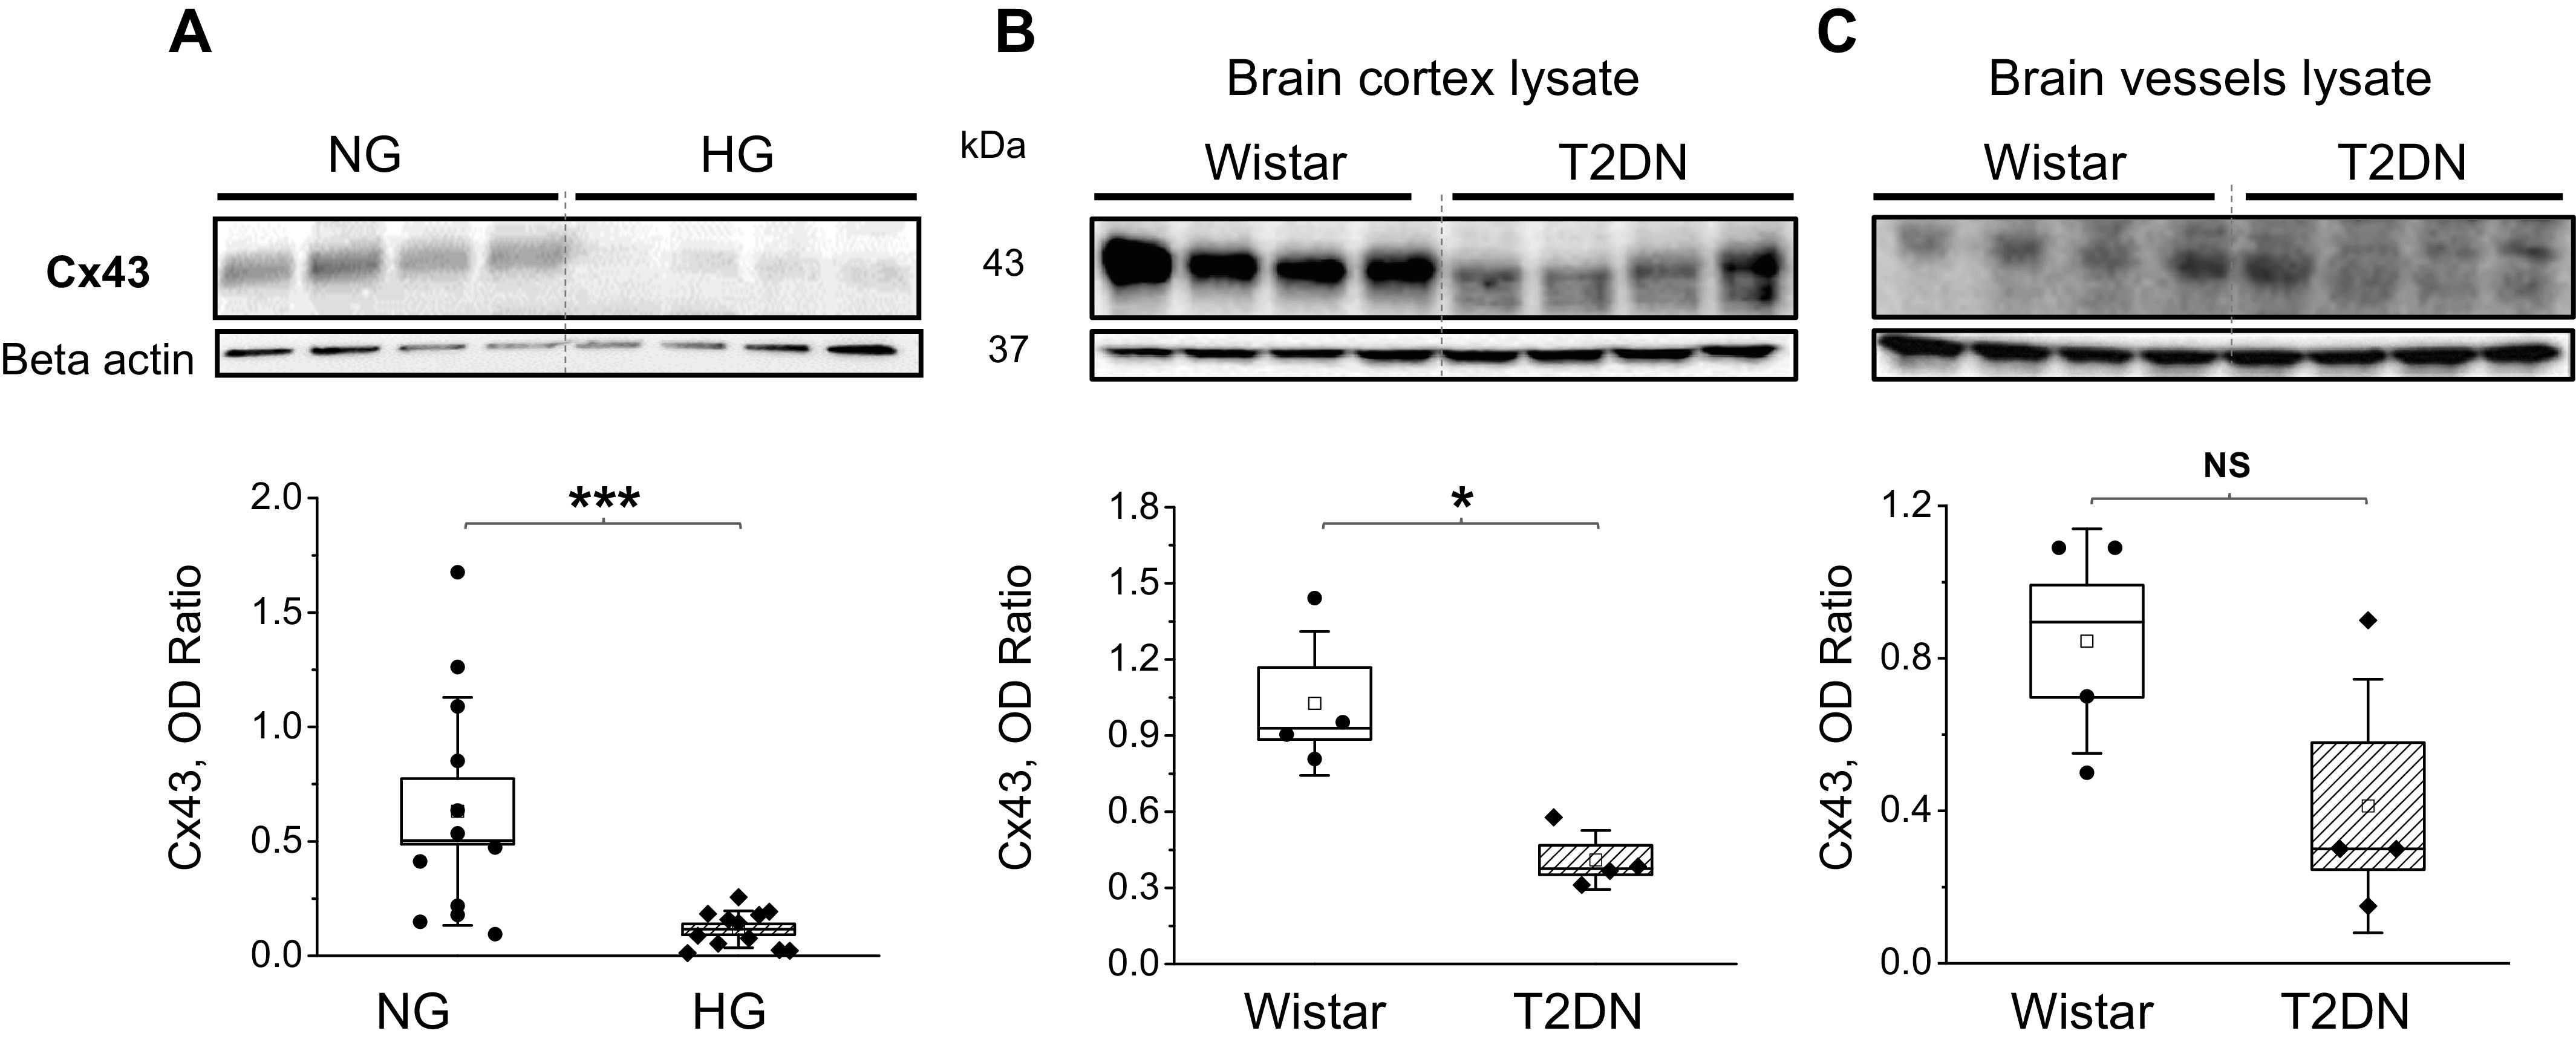
Cx43 protein level expression in chronic high-glucose conditions (HG). A: Western blot analysis of Cx43 expression under normal glucose (NG) or HG. Cx43 OD-optical density relative to β-actin (n = 6 transwell inserts/group, P < 0.001, Student’s t test). Western blot analysis of Cx43 expression in the brain cortex (B) and brain vessels lysate (C) in control Wistar and type 2 diabetes (T2DN) rats (n = 4 rats/group, 48 wk old, Cx43 OD-optical density relative to β-actin; P < 0.05, Student’s t test). Cx43, connexin 43.