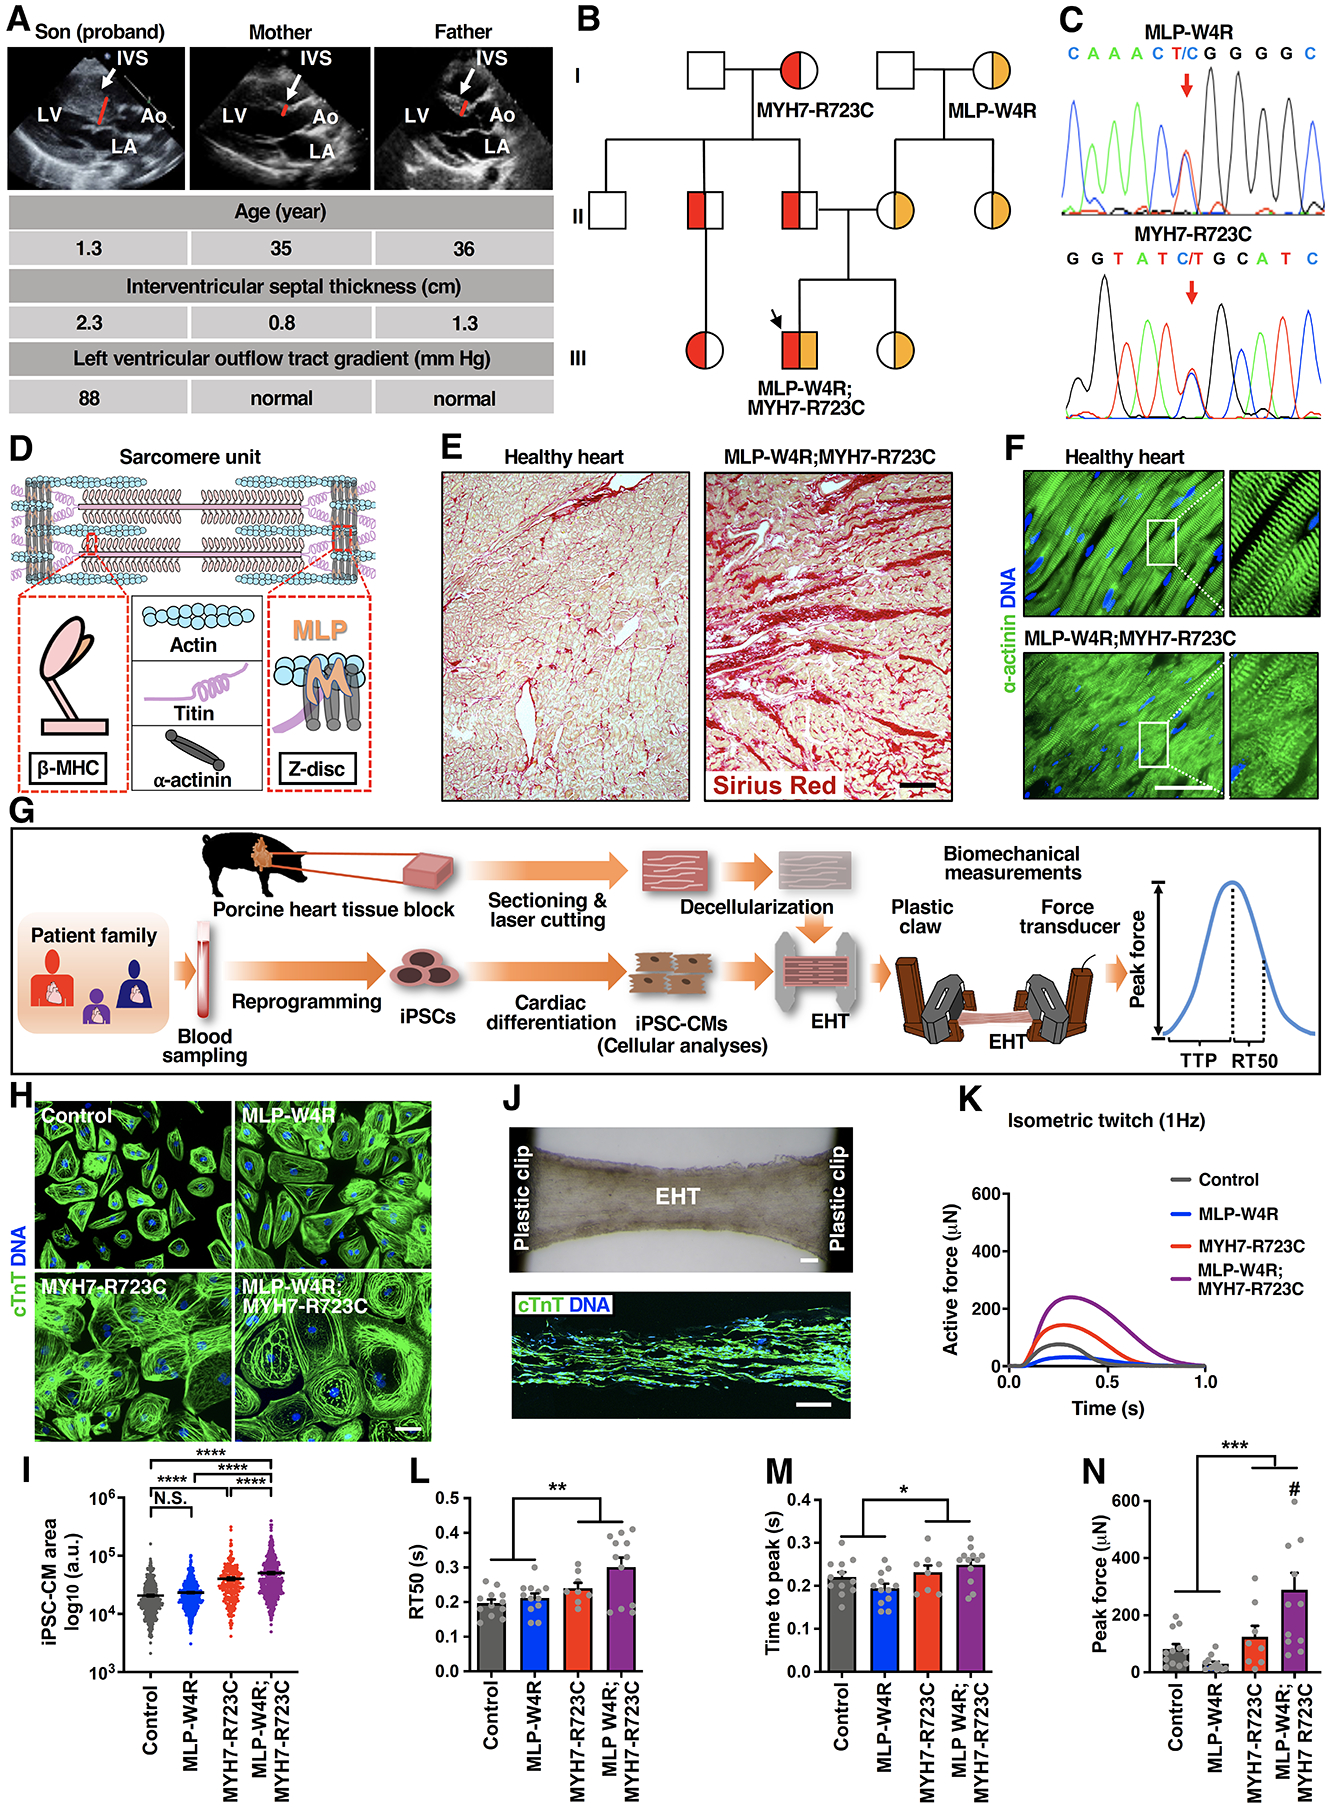
Figure 1. Patient Clinical Phenotypes and HCM Modeling with Patient-Specific iPSC-Derived Cardiomyocytes and Engineered Heart Tissues.

A, Echocardiographic images (parasternal long axis) showing severe interventricular septum (IVS) hypertrophy in the neonatal proband with no overt structural changes in the proband’s parents. LV: left ventricle; LA: left atrium; Ao: aorta. B, Schematic pedigree of the proband exhibiting co-inheritance of the MLP-W4R and MYH7-R723C heterozygous missense mutations (III-2, black arrow). Squares represent male family members and circles represent females. Red indicates the MYH7-R723C heterozygous mutation, and yellow indicates the MLP-W4R heterozygous mutation. See Table S1 for additional clinical characteristics of the proband and family members. C, Confirmation of the heterozygous MLP-W4R and MYH7-R723 mutations in the respective MLP (exon 2) and MYH7 (exon 20) genes via PCR and Sanger sequencing in the proband. Red arrows indicate MLP and MYH7 mutations. See Figure S1D for additional sequencing information. D, Schematic of a sarcomere unit that includes thick filament components β myosin heavy chain (β-MHC; encoded by the MYH7 gene) and titin, thin filament component actin, and Z-disc components α-actinin and MLP. E, Sirius red staining of patient myectomy tissues versus healthy human controls. Scale bar, 200 μm. F, α-actinin immunostaining of patient myectomy tissue versus healthy human control. DNA was counterstained by DAPI. Scale bar, 50 μm. G, Schematic illustrating patient iPSC generation, iPSC-CM derivation, cellular analyses, EHT production, and EHT biomechanical measurements including peak force, time to peak force (TTP), and time from peak force to 50% relaxation (RT50). H, cTnT immunostaining of day 35 control, MLP-W4R, MYH7-R723C, and MLP-W4R;MYH7-R723C iPSC-CMs. Scale bar, 100 μm. I, Quantification of iPSC-CM areas in panel H with ImageJ from more than four independent cardiomyocyte differentiation batches (≥50 cells per batch for each cell type). Two-way ANOVA with Tukey’s multiple comparisons test revealed that the MYH7-R723C and MLP-W4R mutations synergistically regulated cell size (F(1,1985)=7.213, p=0.0073; each mutation considered as an independent factor). Note that the F value indicates the ratio of explained variance between groups to unexplained variance due to experimental variations within groups and the degrees of freedom (df) represent the df for factor (genotype) interaction and the sum of the individual df for each genotype group, respectively. J, Top panel: A representative image of an EHT constructed by seeding day 14 iPSC-CMs into decellularized thin sections of native porcine myocardium followed by an additional 14-day culture. Scale bar, 200 μm. Bottom panel: cTnT immunostaining of a representative EHT section. Scale bar, 200 μm. K, Representative isometric twitches of control, MLP-W4R, MYH7-R723C, and MLP-W4R;MYH7-R723C EHTs under 1 Hz pacing. L-N, Quantification of EHT biomechanical properties (n≥8 per group from three or more independent cardiomyocyte differentiation batches). Two-way ANOVA with Tukey’s multiple comparisons test revealed that there were no statistically significant interactions between the MYH7-R723C and MLP-W4R mutations in regulating RT50 (F(1,40)=1.46, p=0.234) and TTP (F(1, 40)=2.991, p=0.092). The presence of the MYH7-R723C mutation significantly prolonged RT50 (L, F(1,40)=12.200, p=0.001) and TTP (M, F(1,40)=6.857, p=0.012). In addition, these two mutations synergistically increased peak force (N) in the proband EHTs (F(1,40)=8.080, p=0.007). # denotes that proband MLP-W4R;MYH7-R723C EHTs generated significantly higher peak force than MLP-W4R (p<0.0001), MYH7-R723C (p=0.029), or control (p=0.001) EHTs. Note that the degrees of freedom (df) represent the df for each factor (genotype) or factor interaction and the sum of the individual df for each genotype group, respectively (L-N). Each mutation is considered as an independent factor. Each data point represents a single iPSC-CM (I) or EHT (L-N) derived from at least three independent cardiomyocyte differentiation batches. All data are presented as mean ± S.E.M; *p<0.05; **p<0.01; ***p<0.001; ****p<0.0001; N.S.: not significant.
