
Figure 2. Mutant Cardiac Myosin Initiates HCM Phenotype.
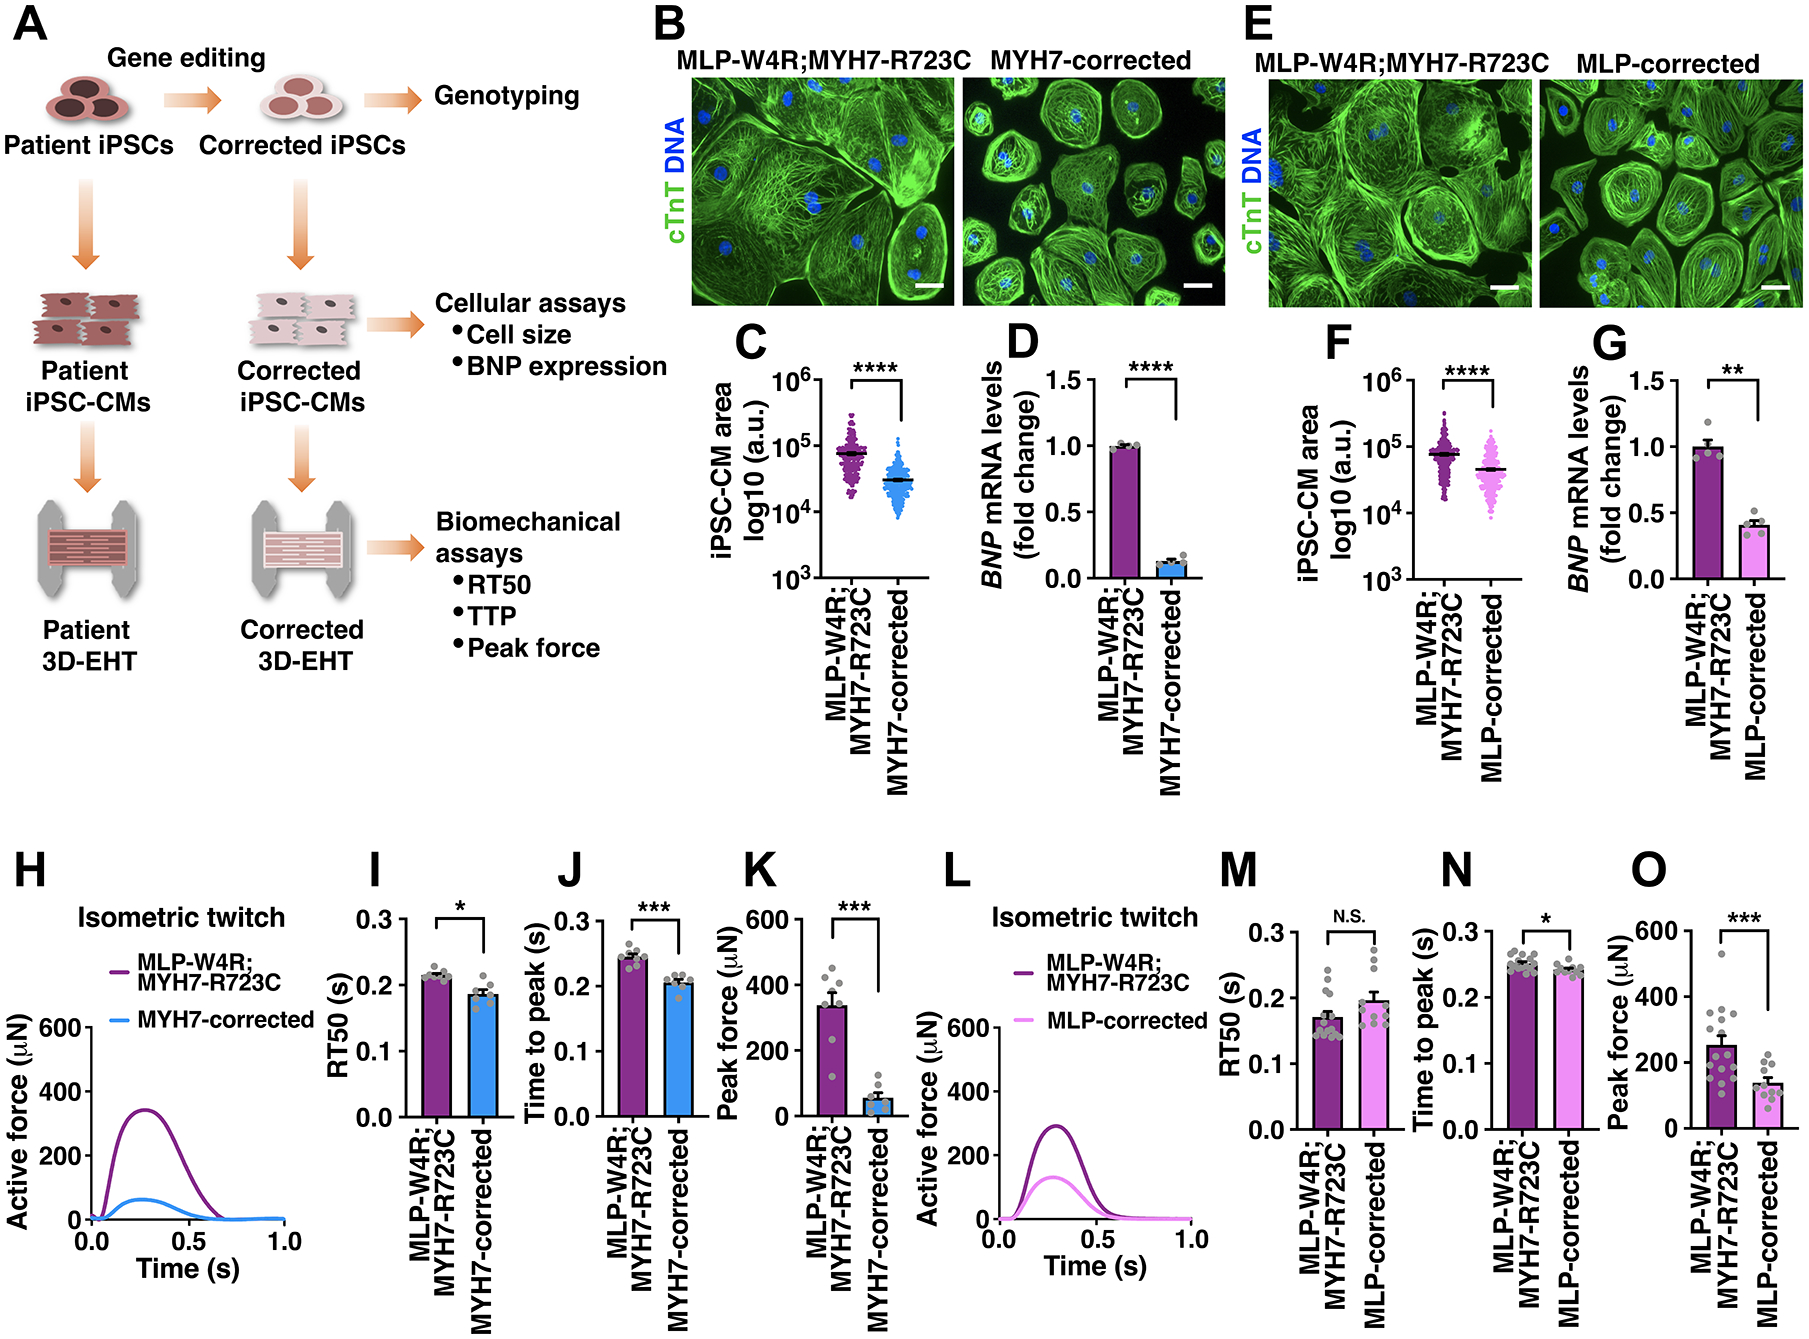
A, Schematic of correcting HCM-associated mutations in iPSCs via gene editing and phenotypic analyses of corrected iPSC-CMs and EHTs. See Figures S2 and S3 for CRISPR-Cas9- and TALEN-mediated correction of the myosin and MLP mutations. B-D, cTnT immunostaining in MLP-W4R;MYH7-R723C and MYH7-corrected (containing MLP-W4R) isogenic iPSC-CMs (B), followed by quantification of cell area based on cTnT staining (C) and analysis of hypertrophic molecular marker BNP via qRT-PCR (D). E-G, cTnT immunostaining in MLP-W4R;MYH7-R723C and MLP-corrected (containing MYH-R723C) isogenic iPSC-CMs (E), followed by quantification of cell area based on cTnT staining (F) and analysis of hypertrophic molecular marker BNP via qRT-PCR (G). Cell areas in panels B and E were quantified with ImageJ from three independent cardiomyocyte differentiation batches (≥100 cells per batch). mRNA expression was normalized to GAPDH and fold change relative to MLP-W4R;MYH7-R723C iPSC-CMs was presented (D: n=4 independent cardiomyocyte differentiation batches per group; G: n=5 independent cardiomyocyte differentiation batches per group). Scale bar (B, E), 100 μm. A two-tailed unpaired Student’s t test was used for cell area comparison (C, F) and a two-tailed unpaired Mann-Whitney U test for gene expression comparison (D, G). H, Representative twitches of EHTs constructed from MLP-W4R;MYH7-R723C and MYH7-corrected isogenic iPSC-CMs under 1 Hz pacing. I-K, Quantification of EHT biomechanical properties including RT50 (I), TTP (J), and peak force (K) (n≥7 per group from three independent cardiomyocyte differentiation batches). L, Representative twitches of EHTs constructed from MLP-W4R;MYH7-R723C and MLP-corrected isogenic iPSC-CMs under 1 Hz pacing. M-O, Quantification of EHT biomechanical properties including RT50 (M), TTP (N), and peak force (O) (n≥11 per group from at least three independent cardiomyocyte differentiation batches). A two-tailed unpaired Mann-Whitney U test was used for analysis between two groups (I-K, M-O). Each data point represents a single iPSC-CM (C and F), EHT (I-K and M-O), or sample generated from a batch of iPSC-CMs (D and G) from at least three independent cardiomyocyte differentiation batches. All data are presented as mean ± S.E.M; *p<0.05; **p<0.01; ***p<0.001; ****p<0.0001; N.S: not significant.