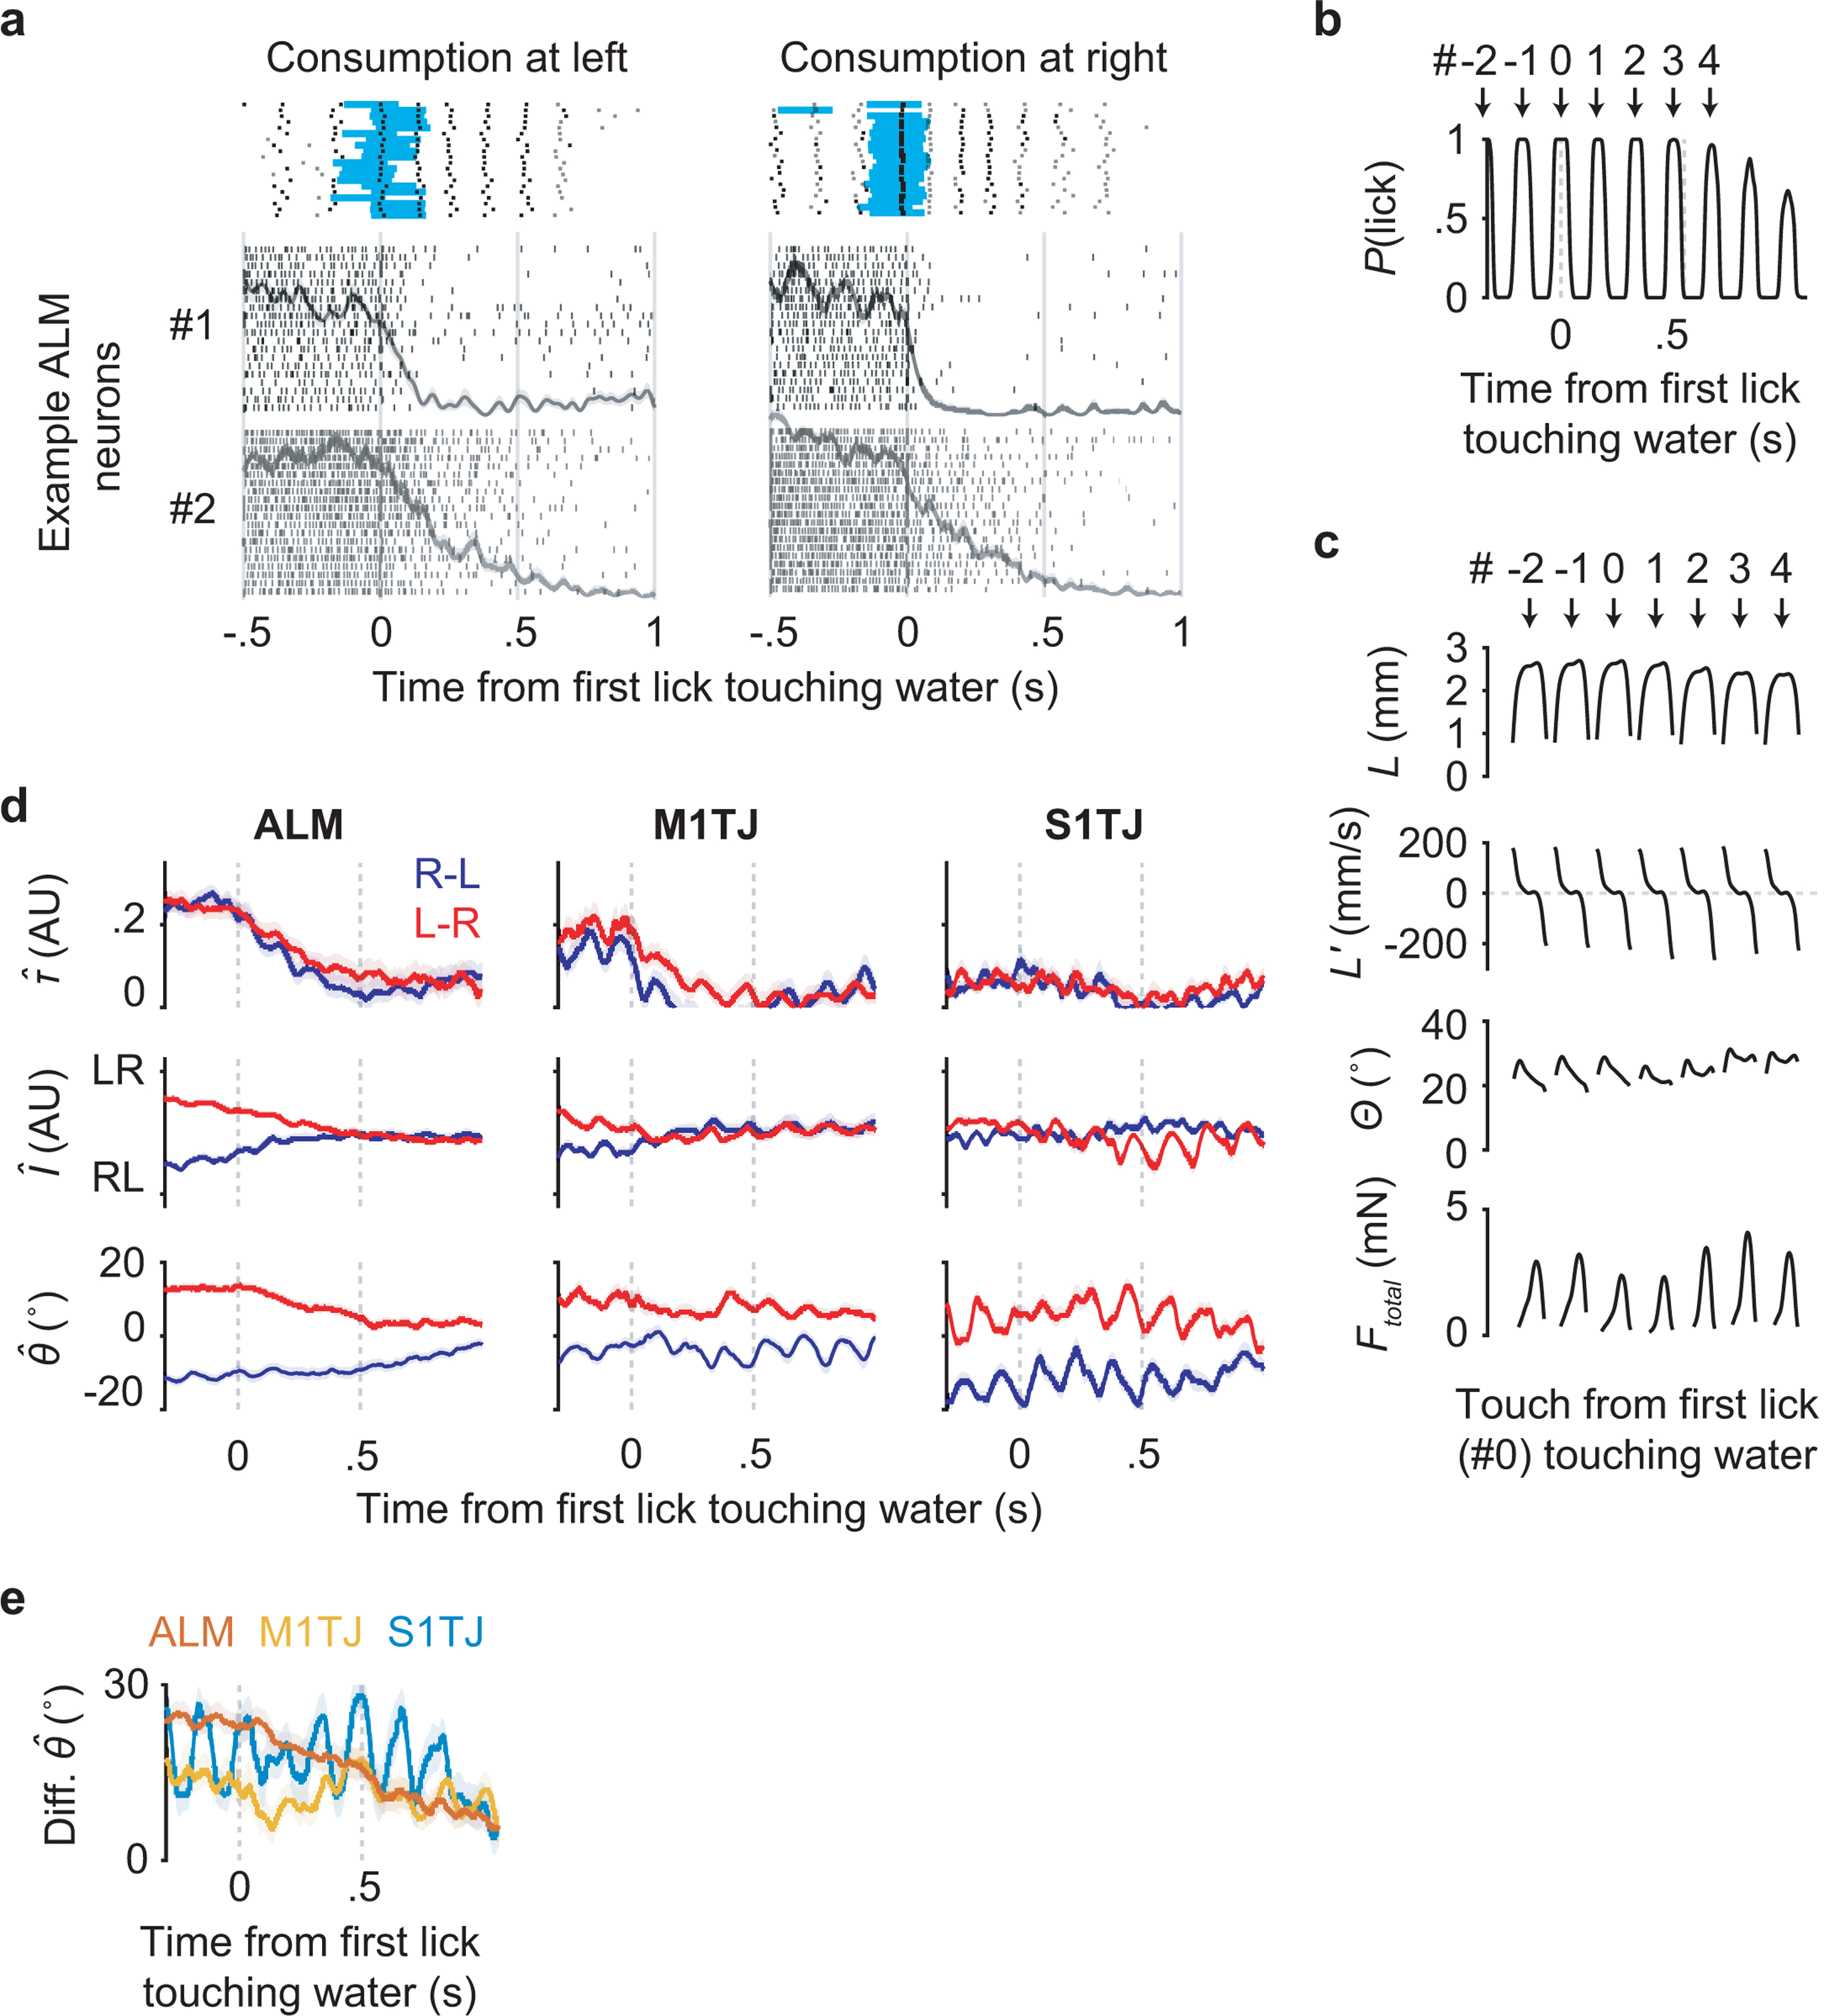
Extended Data Fig. 6. Reward modulation of activity in ALM.

a, Responses of two simultaneously recorded ALM neurons (#1 and #2) aligned at the first lick (specifically the middle of a tongue-out period) that touched water reward. For each sequence direction, shown at top are rasters of lick times (touches in black and misses in gray) and the duration of water delivery (blue) from 20 selected trials (Methods). Stacked below are spike rasters and the corresponding PETHs from the same 20 trials for each example neuron.
b, The probability of licking (i.e. tongue-out) as a function of time. Licks are sequentially indexed with respect to the first lick (#0) touching the water.
c, Patterns of kinematics and force for single licks around the first lick (#0) touching water (n = 25289 trials; mean ± 95% bootstrap confidence interval). The duration of individual licks was normalized. The total force (Ftotal) is the vector sum of vertical and lateral forces.
d, Decoding of τ, I and θ (mean ± 99% bootstrap confidence interval) from neuronal populations recorded in ALM (n = 13 sessions), M1TJ (n = 9 sessions), and S1TJ (n = 8 sessions) in right-to-left (blue) or left-to-right (red) trials around the consumption period.
e, The difference between the decoded θ traces in right-to-left versus left-to-right trials. Same data source, mean and error presentation as in (d).
