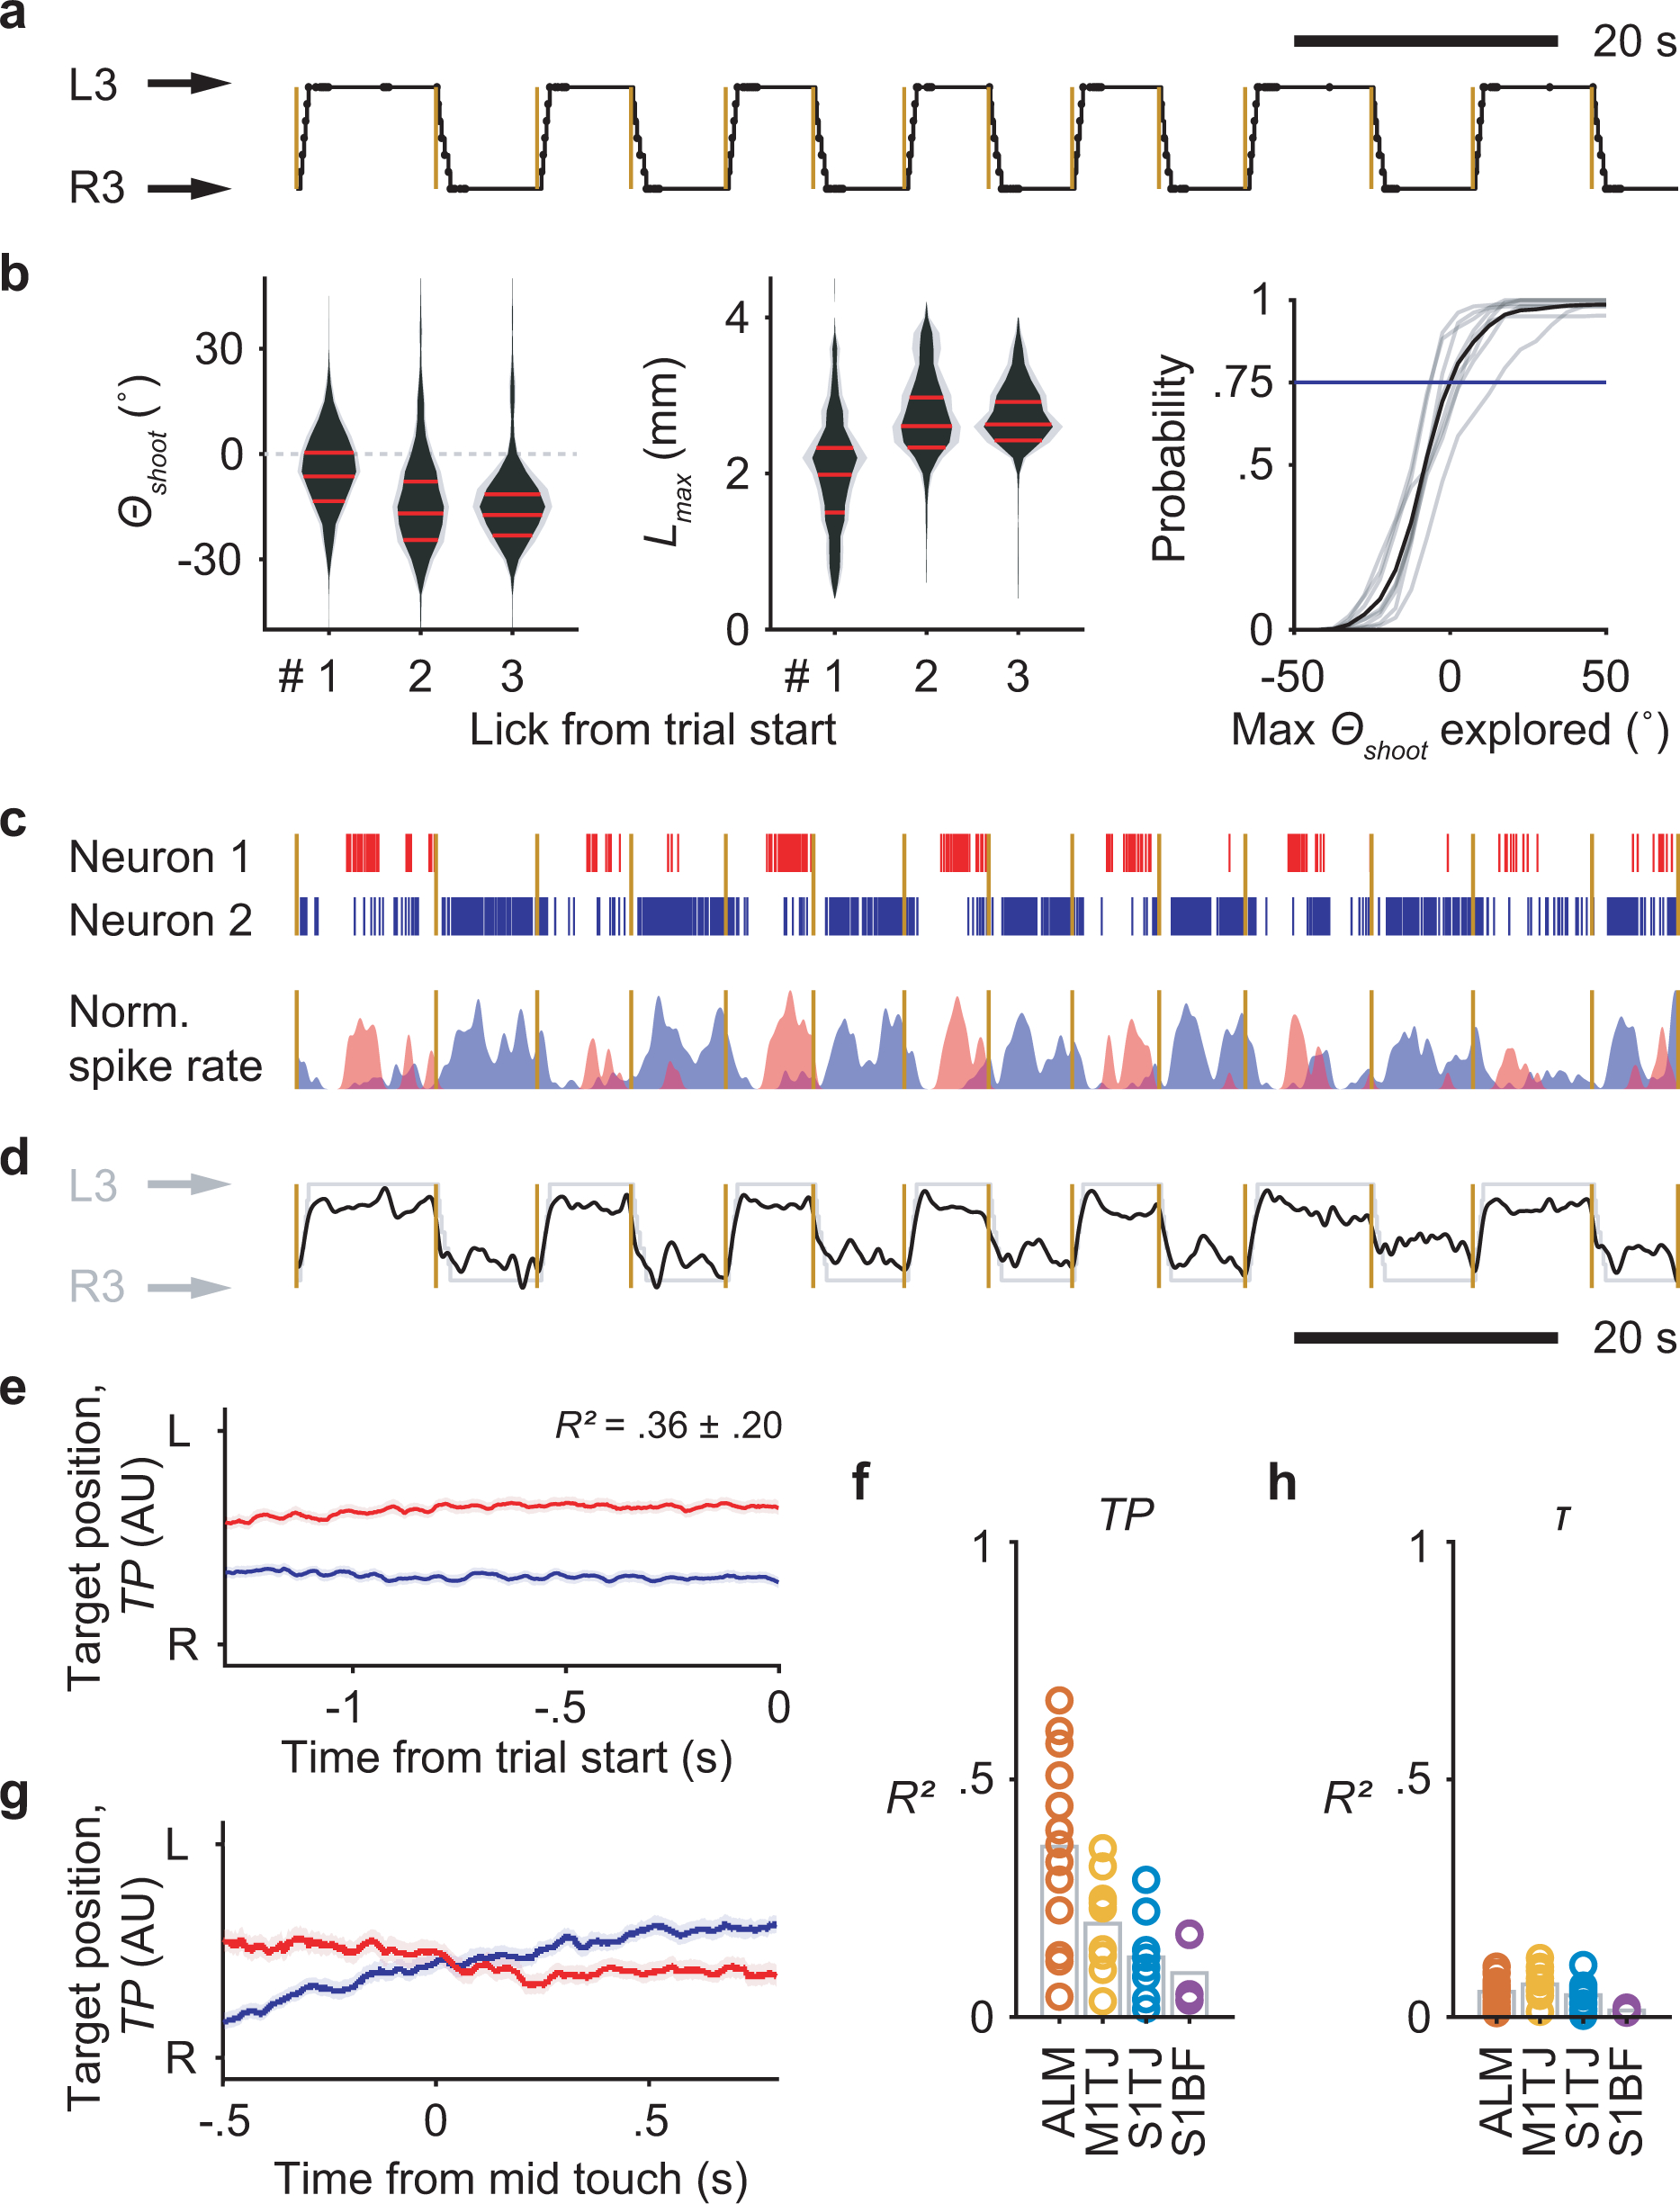
Extended Data Fig. 7. Coding of upcoming sequences in ALM.

a, Depiction of sequences performed by a mouse in alternating directions across 14 consecutive trials. Trial onsets are marked by yellow lines. Port positions shown in the black trace are overlaid with touch onsets (dots).
b, Probability distributions of Θshoot (left) and Lmax (middle) for the first 3 licks at the start of a sequence (n = 8 mice; mean ± SD). The negative y-axis of Θshoot points to the side at which the port is located. The CDF (right; 8 individual mice in gray and the mean in black) of the maximal Θshoot explored before touching the port (at the side of negative Θshoot). The blue line shows the probability of successfully locating the port without exploring beyond the midline.
c, Top, rasters of two example neurons which had persistent and target position (TP) selective firing during the 14 consecutive trials in (a). Bottom, normalized and smoothed (0.25 s SD Gaussian kernel) spike rates of the two neurons.
d, Decoded instantaneous TP (dark trace) from 58 simultaneously recorded units in ALM, overlaid with normalized port position (light trace).
e, Decoding of TP from ALM (mean ± 99% bootstrap confidence interval) before upcoming right-to-left trials (blue) or left-to-right trials (red). Crossvalidated R2 is shown (mean ± SD; n = 13 sessions).
f, Goodness of fit for linear models that predict TP during ITIs, quantified by crossvalidated R2.
g, Using the same linear models in (e) to decode TP during execution of standard right-to-left (blue) or left-to-right (red) sequences (mean ± 99% bootstrap confidence interval).
h, Same as (f) but for τ.
