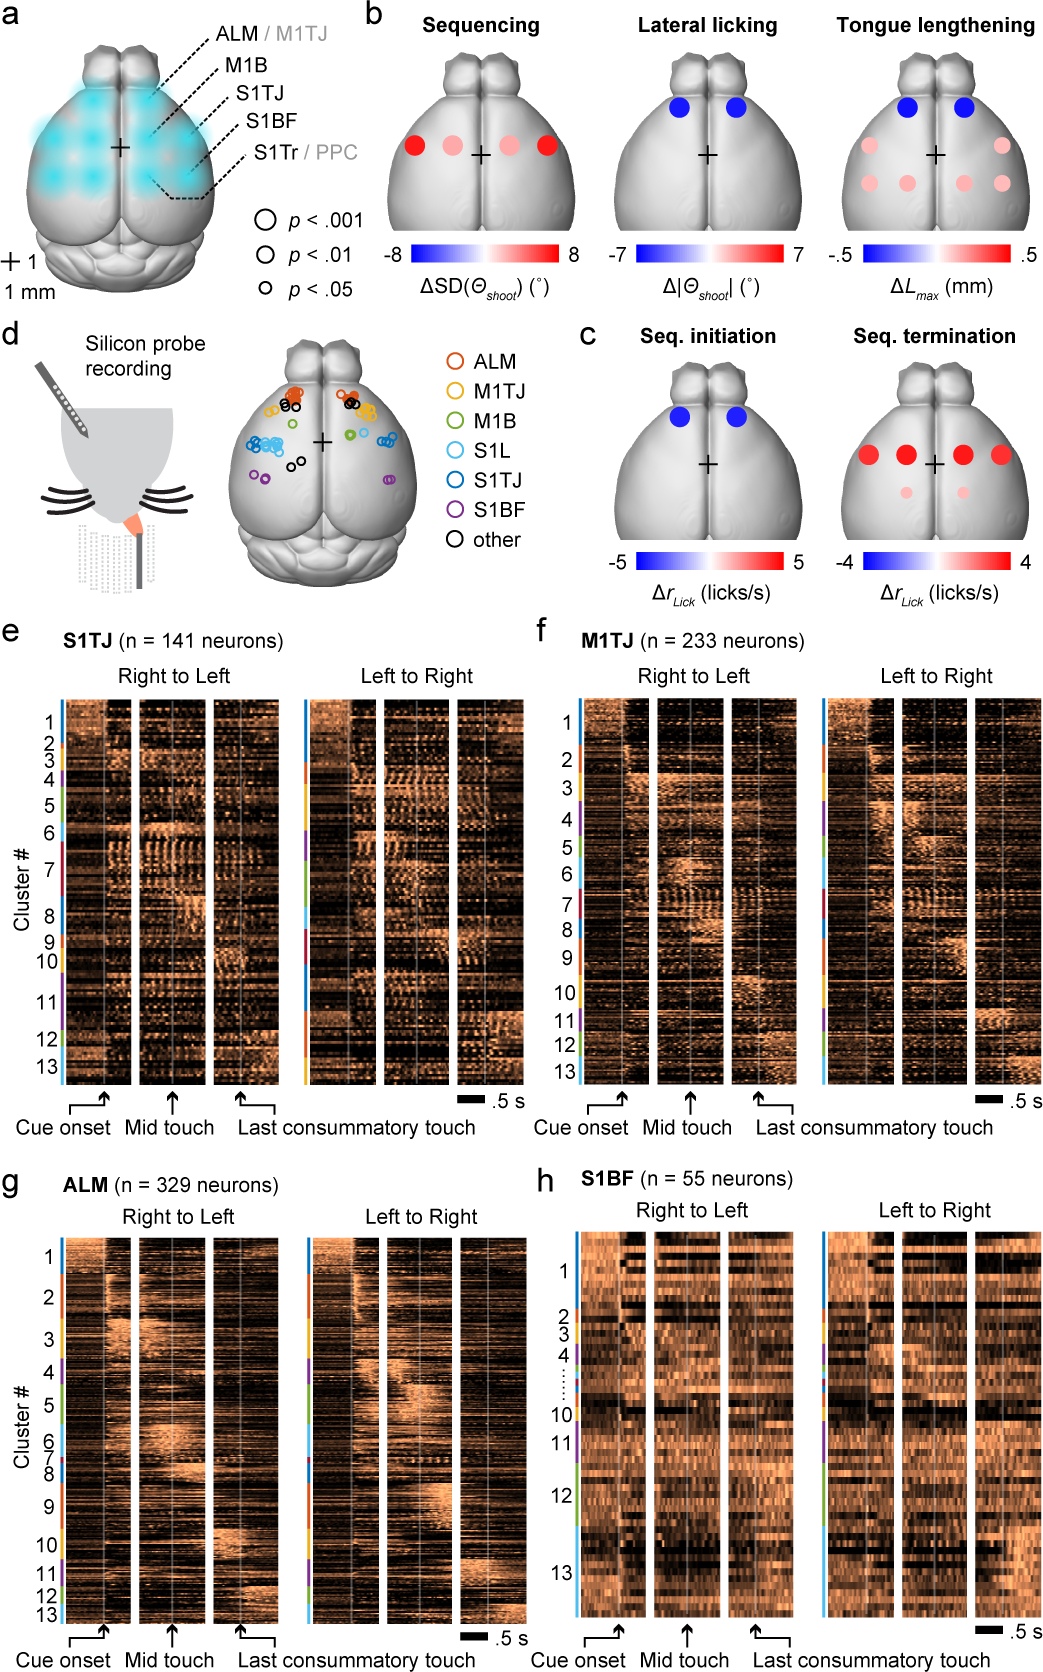
Fig. 2. Optogenetic inhibition and single-unit activity survey across cortical regions during sequence execution.

a, Schematic showing the dorsal view of a mouse brain (Allen Mouse Brain Atlas, Brain Explorer 2). Overlaid spots in blue shading depict the five bilateral pairs of sites for illumination of the target cortical regions. Bregma is marked by a 1 mm × 1 mm crosshair.
b, Summary of changes in licking kinematics resulting from bilateral photoinhibition of each area, quantified across all three inhibition periods (Methods). Plots summarize the quantifications shown in Extended Data Fig. 3j. Dot color depicts the amount of increase (red) or decrease (blue) in the indicated behavioral variable for trials with photoinhibition compared with those without. Dot size represents the level of statistical significance. Changes with p > 0.05 are not plotted. Two-tailed hierarchical bootstrap test with Bonferroni correction for 15 comparisons. n = 7 mice.
c, Summary of changes in lick rate resulting from bilateral photoinhibition of each area during either sequence initiation (left) or sequence termination (right). Plots summarize the quantifications shown in Extended Data Fig. 3k (top and bottom rows). Conventions and statistical tests as in (b), but with Bonferroni correction for 30 comparisons.
d, Left, silicon probe recording during the sequence licking task. Right, histologically verified locations of silicon probe recordings.
e, Normalized PETHs of all S1TJ neurons plotted as heatmaps, aligned to three periods in each sequence direction. Neurons are grouped by functional clusters (Results) and labeled by color bands.
f, Same as (e) but for all M1TJ neurons.
g, Same as (e) but for all ALM neurons.
h, Same as (e) but for all S1BF neurons.
TJ, tongue and jaw; B, body; BF, barrel field (whiskers); Tr, trunk; L, limbs.
