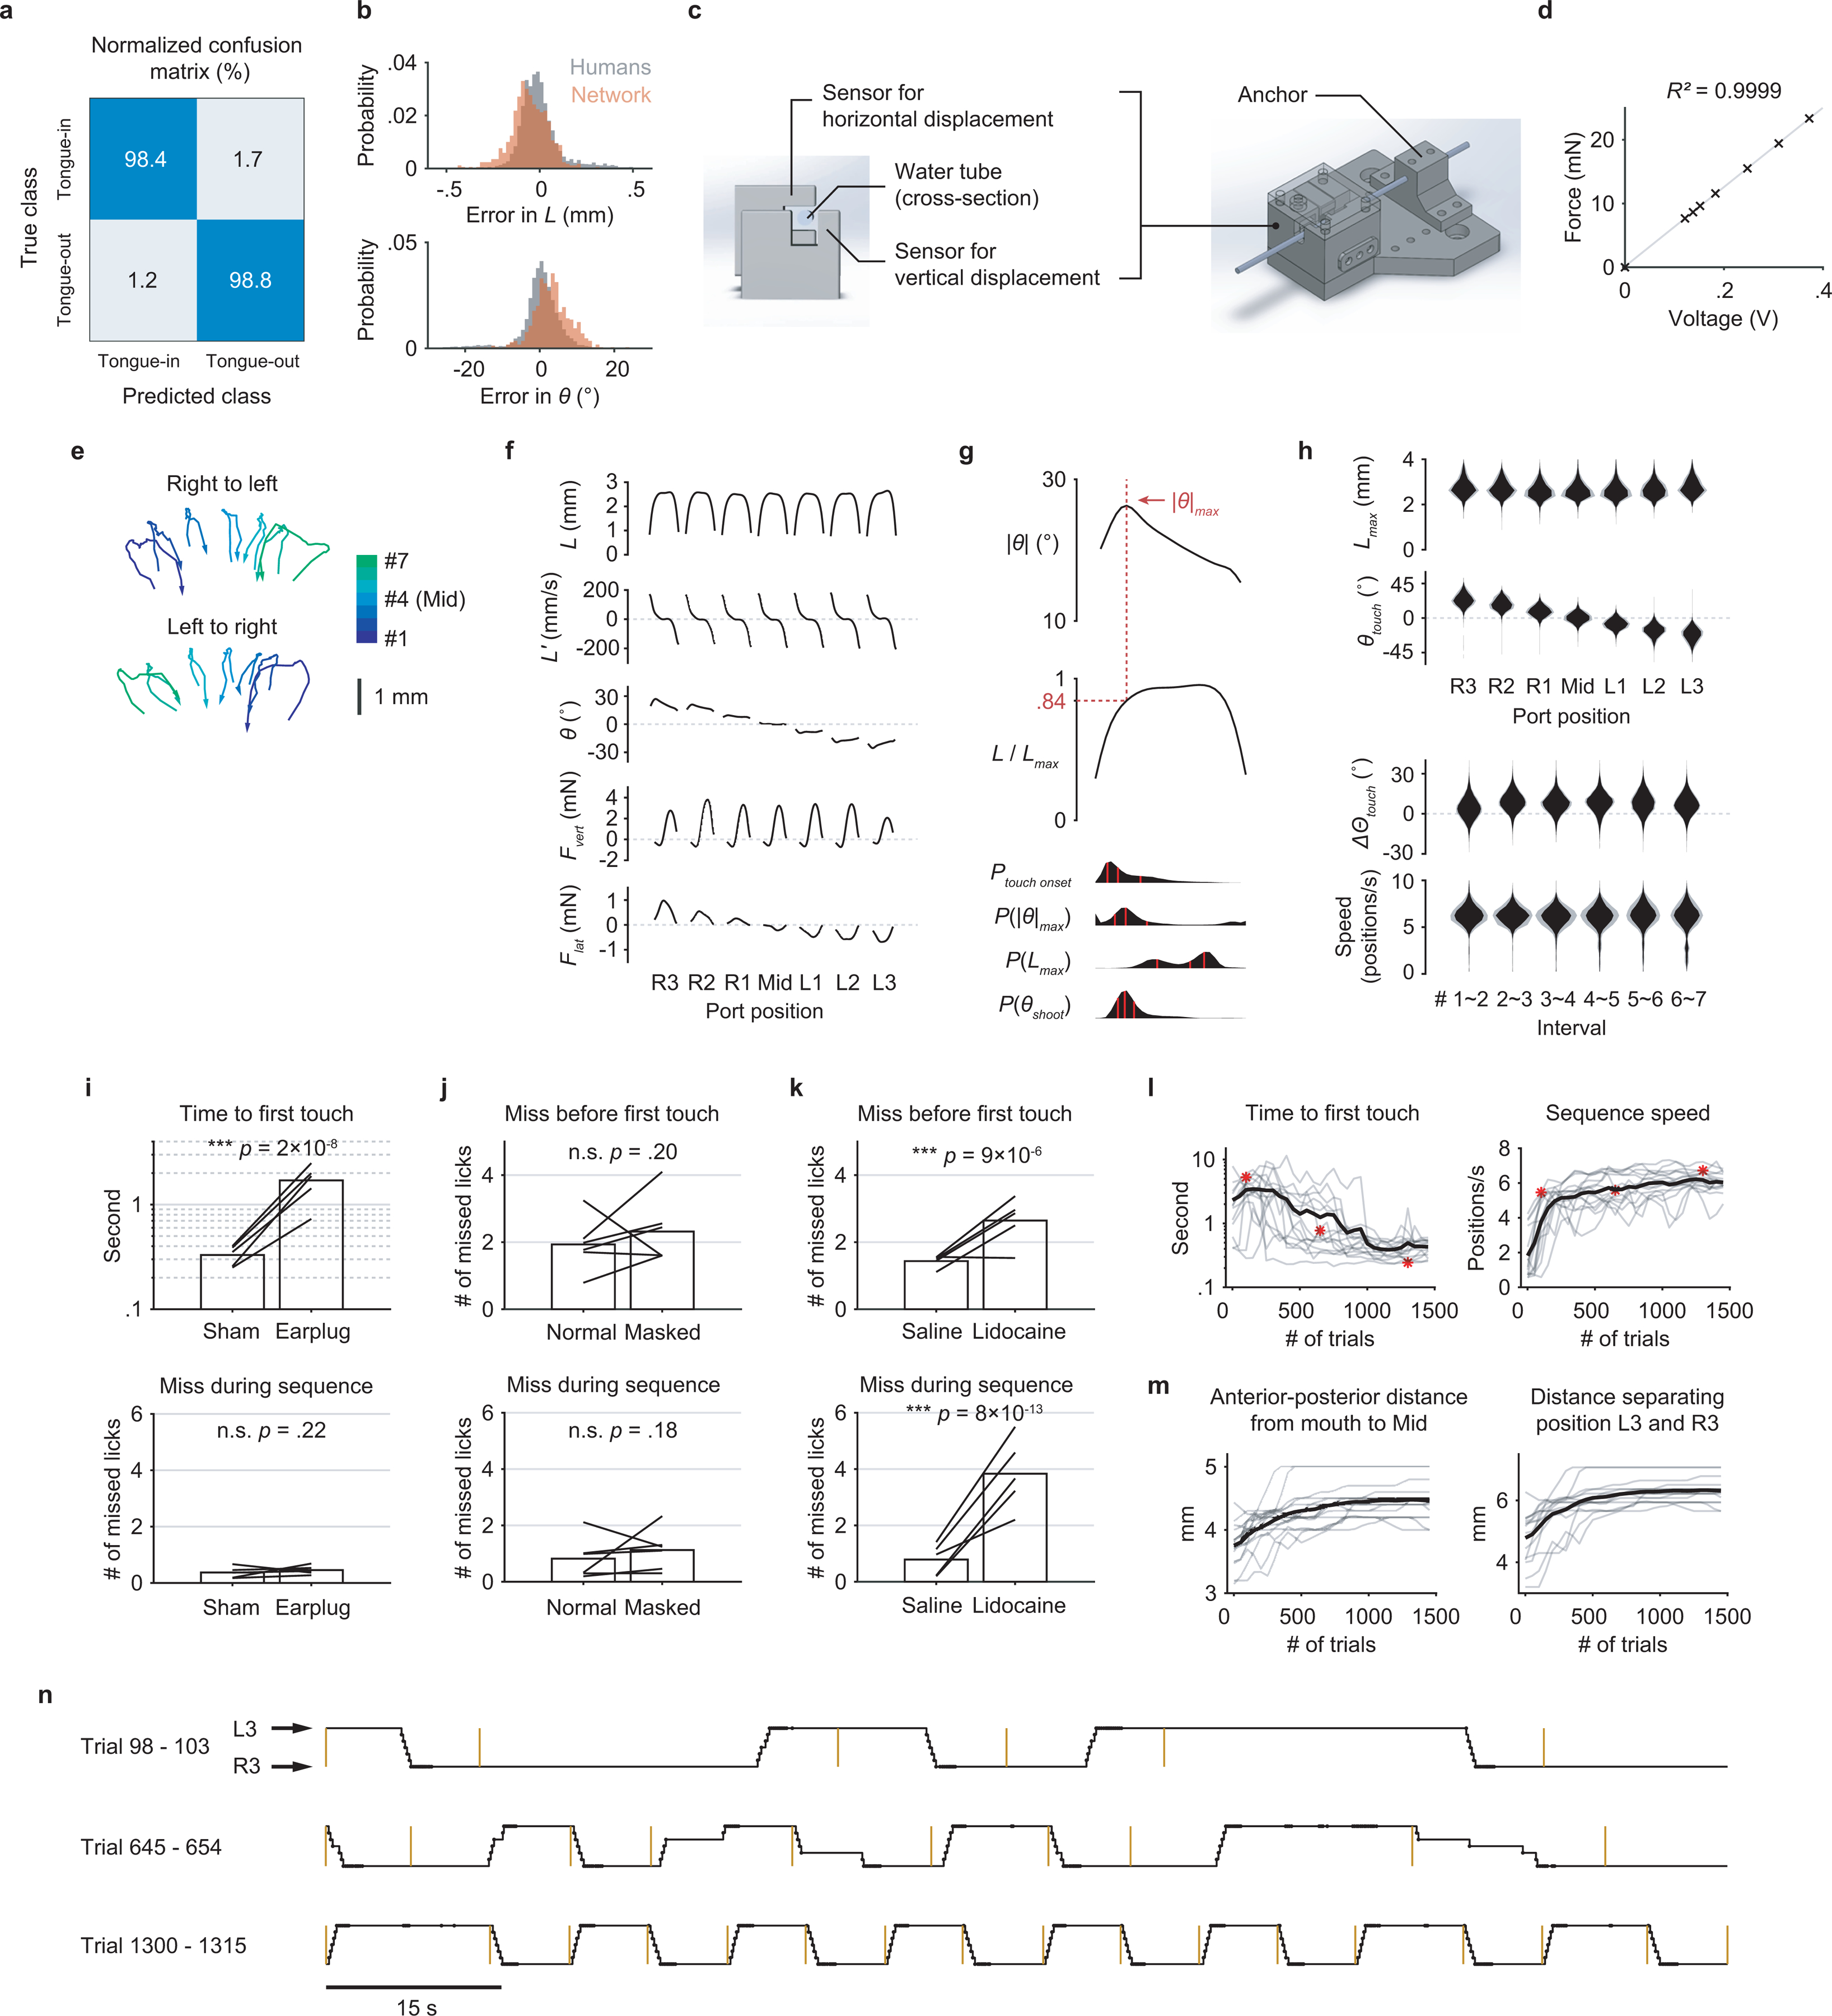
Extended Data Fig. 1. Behavioral measurements, performance, and control experiments.

a, Confusion matrix showing the performance of the classification network. The numbers represent percentages within each (true) class (n = 1696 frames).
b, Performance of the regression network. Top, the gray probability distribution shows how L from five human individuals varied from the mean L across the five. The red distribution shows how predicted L varied from the human mean. Bottom, similar quantification as the top but for θ. n = 573 frames.
c, CAD images of the sensor core (left) and the assembly (right) with a lick tube.
d, Linear relationship between the applied force and the sensor output voltage.
e, Two example trials showing the trajectories of the tongue tip when a mouse sequentially reached the 7 port positions, for both sequence directions. Arrows indicate the direction of time within each trajectory.
f, Patterns of kinematics and forces of single licks at each port position (n = 25683 trials from 17 mice; mean ± 95% bootstrap confidence interval). The duration of individual licks was normalized.
g, Top, the pattern of angle deviation from midline (|θ|) of single licks pooled from R3 and L3. The vertical line indicates maximum |θ| (|θ|max). Middle, tongue length (L) expressed as a fraction of its maximum (Lmax). The horizontal line indicates, on average, the fraction where |θ|max occurred. Bottom, time aligned probability distributions showing when touch onset, |θ|max, Lmax, or θshoot occurred. Red lines mark quartiles. n = 25683 trials from 17 mice. Lick patterns show mean ± 95% bootstrap confidence interval.
h, Top, probability distributions of Lmax and θtouch for licks at each port position. Bottom, probability distributions of the change in Θtouch (ΔΘtouch) and instantaneous sequence speed (Methods) for each interval separating port positions. Distributions show mean ± SD across n = 17 mice.
i, Median time to first touch (top) and the average number of missed licks during sequence performance (bottom) in control (Sham) versus hearing loss (Earplug) conditions. Bars show group means and lines show data from individual mice. ∗∗∗ p < 0.001, n.s. p > 0.05, paired one-tailed bootstrap test, n = 5 mice.
j, Average number of missed licks before first touch (top) and during sequence performance (bottom) in control (Normal) versus odor masking (Masked) conditions. Same statistical tests as in (i), n = 6 mice.
k, Similar to (j) but comparing control (Saline) versus tongue numbing (Lidocaine) conditions. n = 5 mice.
l, Learning curves for 15 individual mice (gray) and the mean (black) showing a reduction in sequence initiation time (left) in response to the auditory cue and an increase in sequence speed (right). The three red asterisks correspond to the three examples of sequence performance shown in (n).
m, Gradual increase in task difficulty (Methods) accompanying the improved performance shown in (l).
n, Depiction of example sequences performed by a mouse in alternating directions across consecutive trials at different stages of learning. Trial onsets are marked by yellow bars. Port positions shown in the black trace are overlaid with touch onsets (dots).
