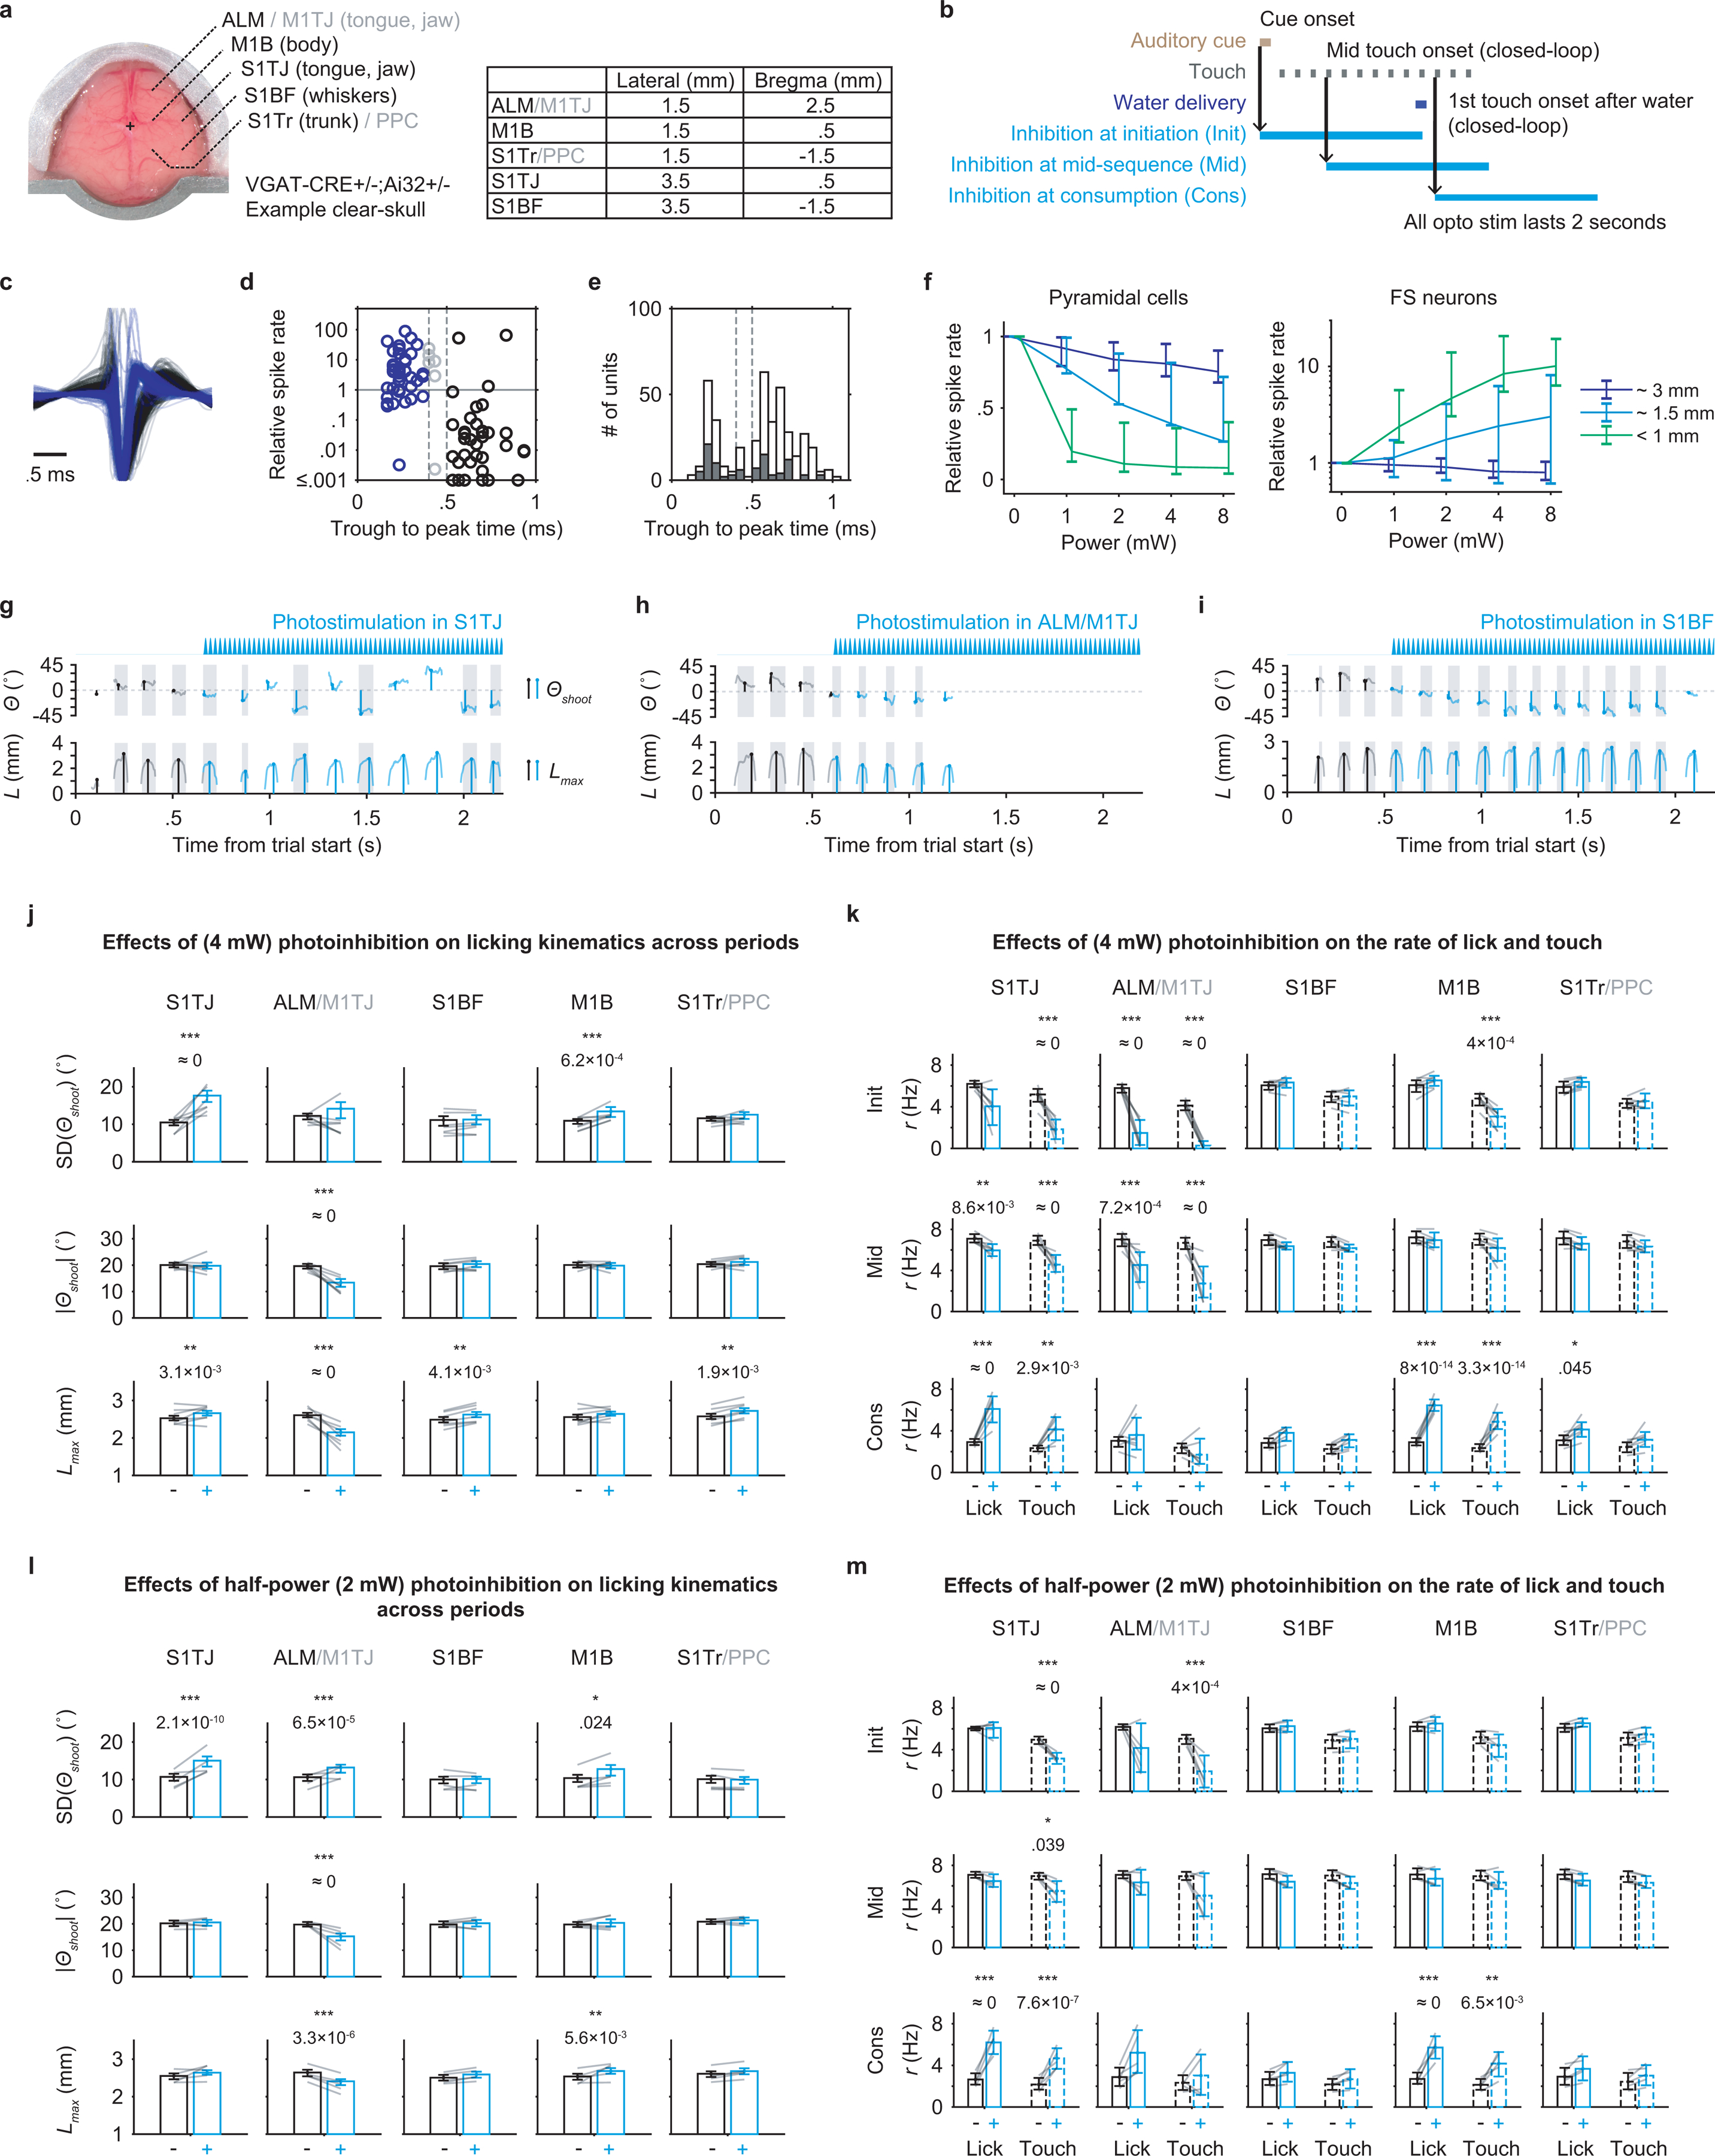
Extended Data Fig. 3. Closed-loop optogenetic inhibition defines cortical areas involved in sequence control.

a, Left, dorsal view of an example “clear-skull” preparation. Right, table shows the center coordinates used for illumination for each target region.
b, Triggering scheme for photoinhibition at sequence initiation, mid-sequence and water consumption.
c, Average spike waveform of putative pyramidal cells (black; n = 224) and putative FS neurons (blue; n = 117), normalized to the amplitude of negative peaks.
d, Relationship between spike widths (defined as the trough to peak time of average waveform) and changes in mean spike rate under opto illumination (4mW, within 1 mm) relative to baseline. Pyramidal cells (black; n = 42) and FS neurons (blue; n = 41) were classified by the two thresholds (dashed lines at 0.4 and 0.5 ms) with ambiguous units (gray; n = 6) in the middle.
e, Distributions of spike widths from neurons in (d) (filled bars; n = 89) and from all neurons (empty bars; n = 414) including those where illuminations were not at recording sites. Classification thresholds are shown in dashed lines.
f, Left, inhibition efficiency of putative pyramidal cells as a function of light power and distance away from the center of illumination (n = 224 units total). Right, similar to left but showing the excitation efficiency of putative FS neurons (n = 117 units total). Mean ± 95% hierarchical bootstrap confidence interval.
g, Example trial with S1TJ inhibition triggered at mid-sequence. Instantaneous tongue angle (Θ) and length (L) are shown in lighter traces. Shooting angles (Θshoot) and maximum length (Lmax) of each lick are marked using stems on top of the instantaneous traces. The blue waveform indicates photostimulation. Traces and markers during photostimulation are colored blue.
h, Similar to (g) but inhibiting ALM/M1TJ.
i, Similar to (g) but inhibiting S1BF.
j, Changes in licking kinematics (rows) when inhibiting each of the five brain regions (columns), quantified across all three inhibition periods (Methods). Bar plots show mean ± 99% hierarchical bootstrap confidence interval. Gray lines show the data of individual mice. Two-tailed hierarchical bootstrap test, ∗∗∗ p < 0.001, ∗∗ p < 0.01, ∗ p < 0.05, n.s. p ≥ 0.05, after Bonferroni correction for 15 comparisons.
k, Changes in the rate of lick (solid bars) and touch (dashed bars) at each of the inhibition periods (rows) when inhibiting each of the five brain regions (columns). Plot style and statistical tests are the same as in (j) but using Bonferroni correction for 30 comparisons.
l, Same convention as in (j) but showing results with half-power (2 mW) inhibition.
m, Same convention as in (k) but showing results with half-power (2 mW) inhibition.
