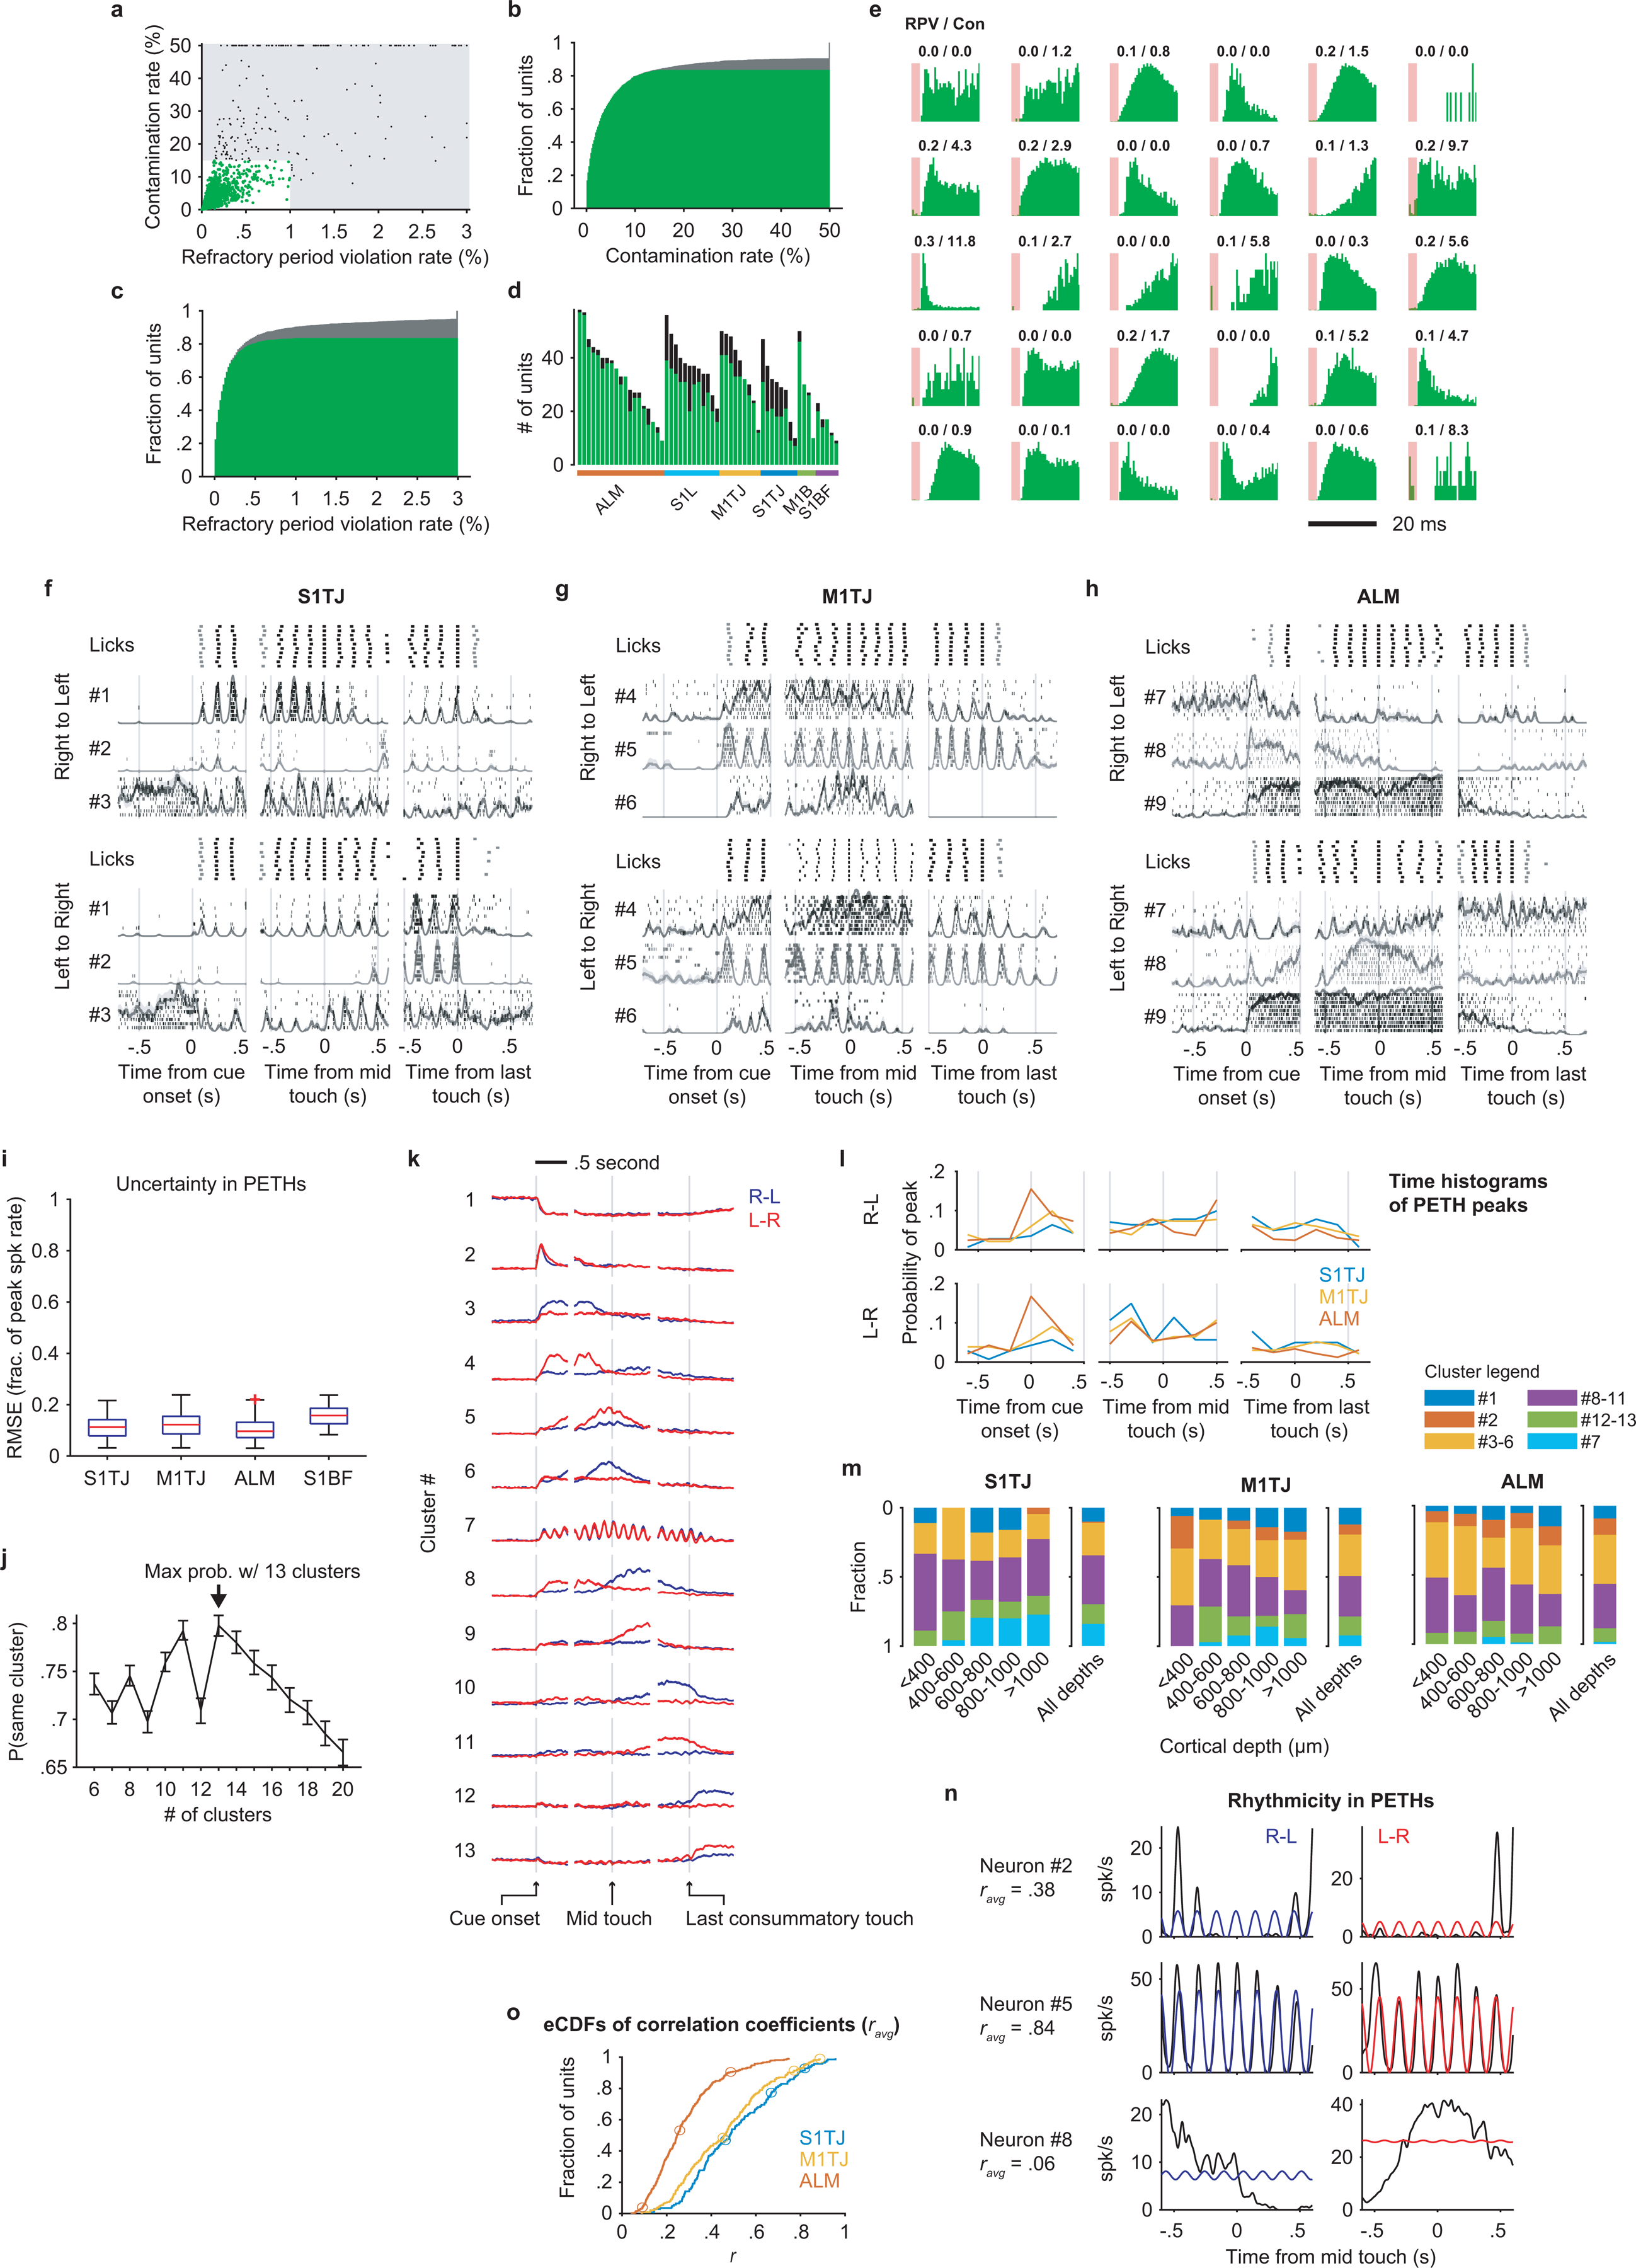
Extended Data Fig. 4. Characterization of single-unit responses.

a, Contamination rates and refractory period violation rates of all recorded single- (green) and multi-units (black). The shaded region shows the thresholds for assignment as multi- vs single-unit.
b, CDF of contamination rate including single- (green) and multi-units (gray).
c, Same as (b) but for refractory period violation rate.
d, The number of single- (green) and multi-units (black) recorded in each session, grouped by brain area.
e, ISI histograms of randomly selected single-units. Refractory period violation rates (RPV) and contamination rates (Con) are labeled on the top (in percent).
f, Responses of three simultaneously recorded S1TJ neurons during right-to-left (top half) or left-to-right (bottom half) licking sequences, aligned at cue onset (left column), middle touch (middle column), and the last consummatory touch (right column). For each sequence direction, the first row shows rasters of lick times (touches in black and misses in gray) from 10 selected trials (Methods). Stacked below are spike rasters and the corresponding PETHs (mean ± SE) from the same 10 trials for each example neuron.
g, Same as (f) but for three example neurons from M1TJ.
h, Same as (f) but for three example neurons from ALM.
i, Uncertainty in mean spike rate (normalized to peak) estimated by bootstrap crossvalidation (Methods). Each data point is the bootstrap average value of the root mean squared error (RMSE) for a single neuron. Data (n = 804 neurons) are grouped by brain region and presented in whisker-box plots (centre mark: median, bounds of box: 25th and 75th percentiles, max whisker length: 1.5 times IQR, no max or min limit).
j, The probability (mean ± 95% bootstrap confidence interval) of a PETH being consistently grouped into the same cluster across bootstrap iterations for different total numbers of clusters. Maximal consistency was achieved when using thirteen clusters for NNMF (arrow).
k, NNMF components that represent each of the thirteen PETH clusters. Right-to-left (blue) and left-to-right (red) activities (mean ± 95% bootstrap confidence interval) are overlaid together. The vertical lines are located at time zero in each period. The height of the lines represents the scale of normalized neuronal activity from 0 to 1.
l, Histograms of PETH peak times. Plot organization and time alignment are the same as in (f).
m, Proportions of neurons from different clusters at different cortical depths. Some clusters with similar types of response were grouped together for better readability. ALM (n = 324), M1TJ (n = 233) and S1TJ (n = 119).
n, Quantification of rhythmicity in PETHs. Black traces are mid-sequence PETHs of three example neurons in (f), (g), and (h). Colored traces show the best fit licking rhythms (6.5 Hz sinusoids). Average Pearson’s correlation coefficients (ravg) of the left-to-right and right-to-left fits are shown beneath neuron IDs.
o, Empirical CDFs of ravg for neurons in S1TJ, M1TJ, and ALM. Circles mark the values of the 9 example neurons in (f), (g), and (h).
