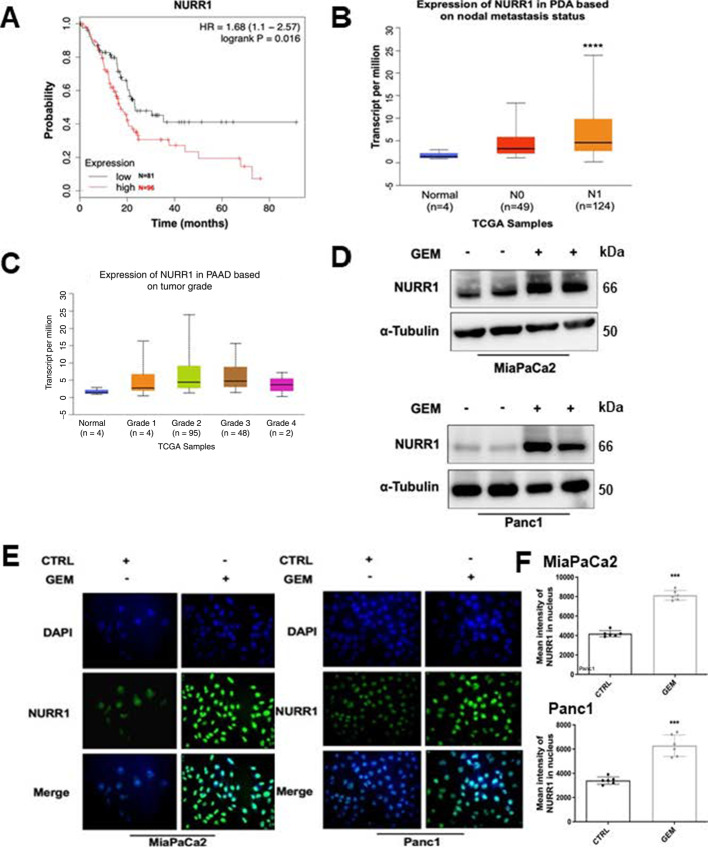
FIGURE 1.
NURR1 confers to PDA chemoresistance. A, TCGA research network for PDA database was used for expression of NURR1 mRNA and correlated with patient's disease-free survival by using Kaplan–Meier survival analysis with log-rank tests (P < 0.016). B,NURR1 mRNA expression levels in patients with PDA based on nodal metastasis status. For each boxplot, median expression value, and 1st and 3rd quartiles are indicated (****, P < 0.00001). C,NURR1 mRNA expression levels in patients with PDA based on tumor grade. D, Immunoblot analysis of NURR1 protein lysates from MiaPaCa2 and Panc1 cells after 48 hours of treatment with gemcitabine (GEM; 1 μmol/L). β-Tubulin serves as a loading control (three independent experiments performed). E, Immunofluorescence staining of MiaPaCa2 and Panc1cells after 24 hours of treatment with gemcitabine (1 μmol/L) NURR1, Alexa Fluor 488 (green); nucleus, DAPI. Merged image, nuclear localization of NURR1 (three independent experiments performed, and at least 10 images per slide were analyzed for each condition). Magnification, 40×. F, Bars represent the quantification of mean intensity of NURR1 in the nucleus. Each data point represents the mean ± SEM of three independent experiments (***, P < 0.001).

