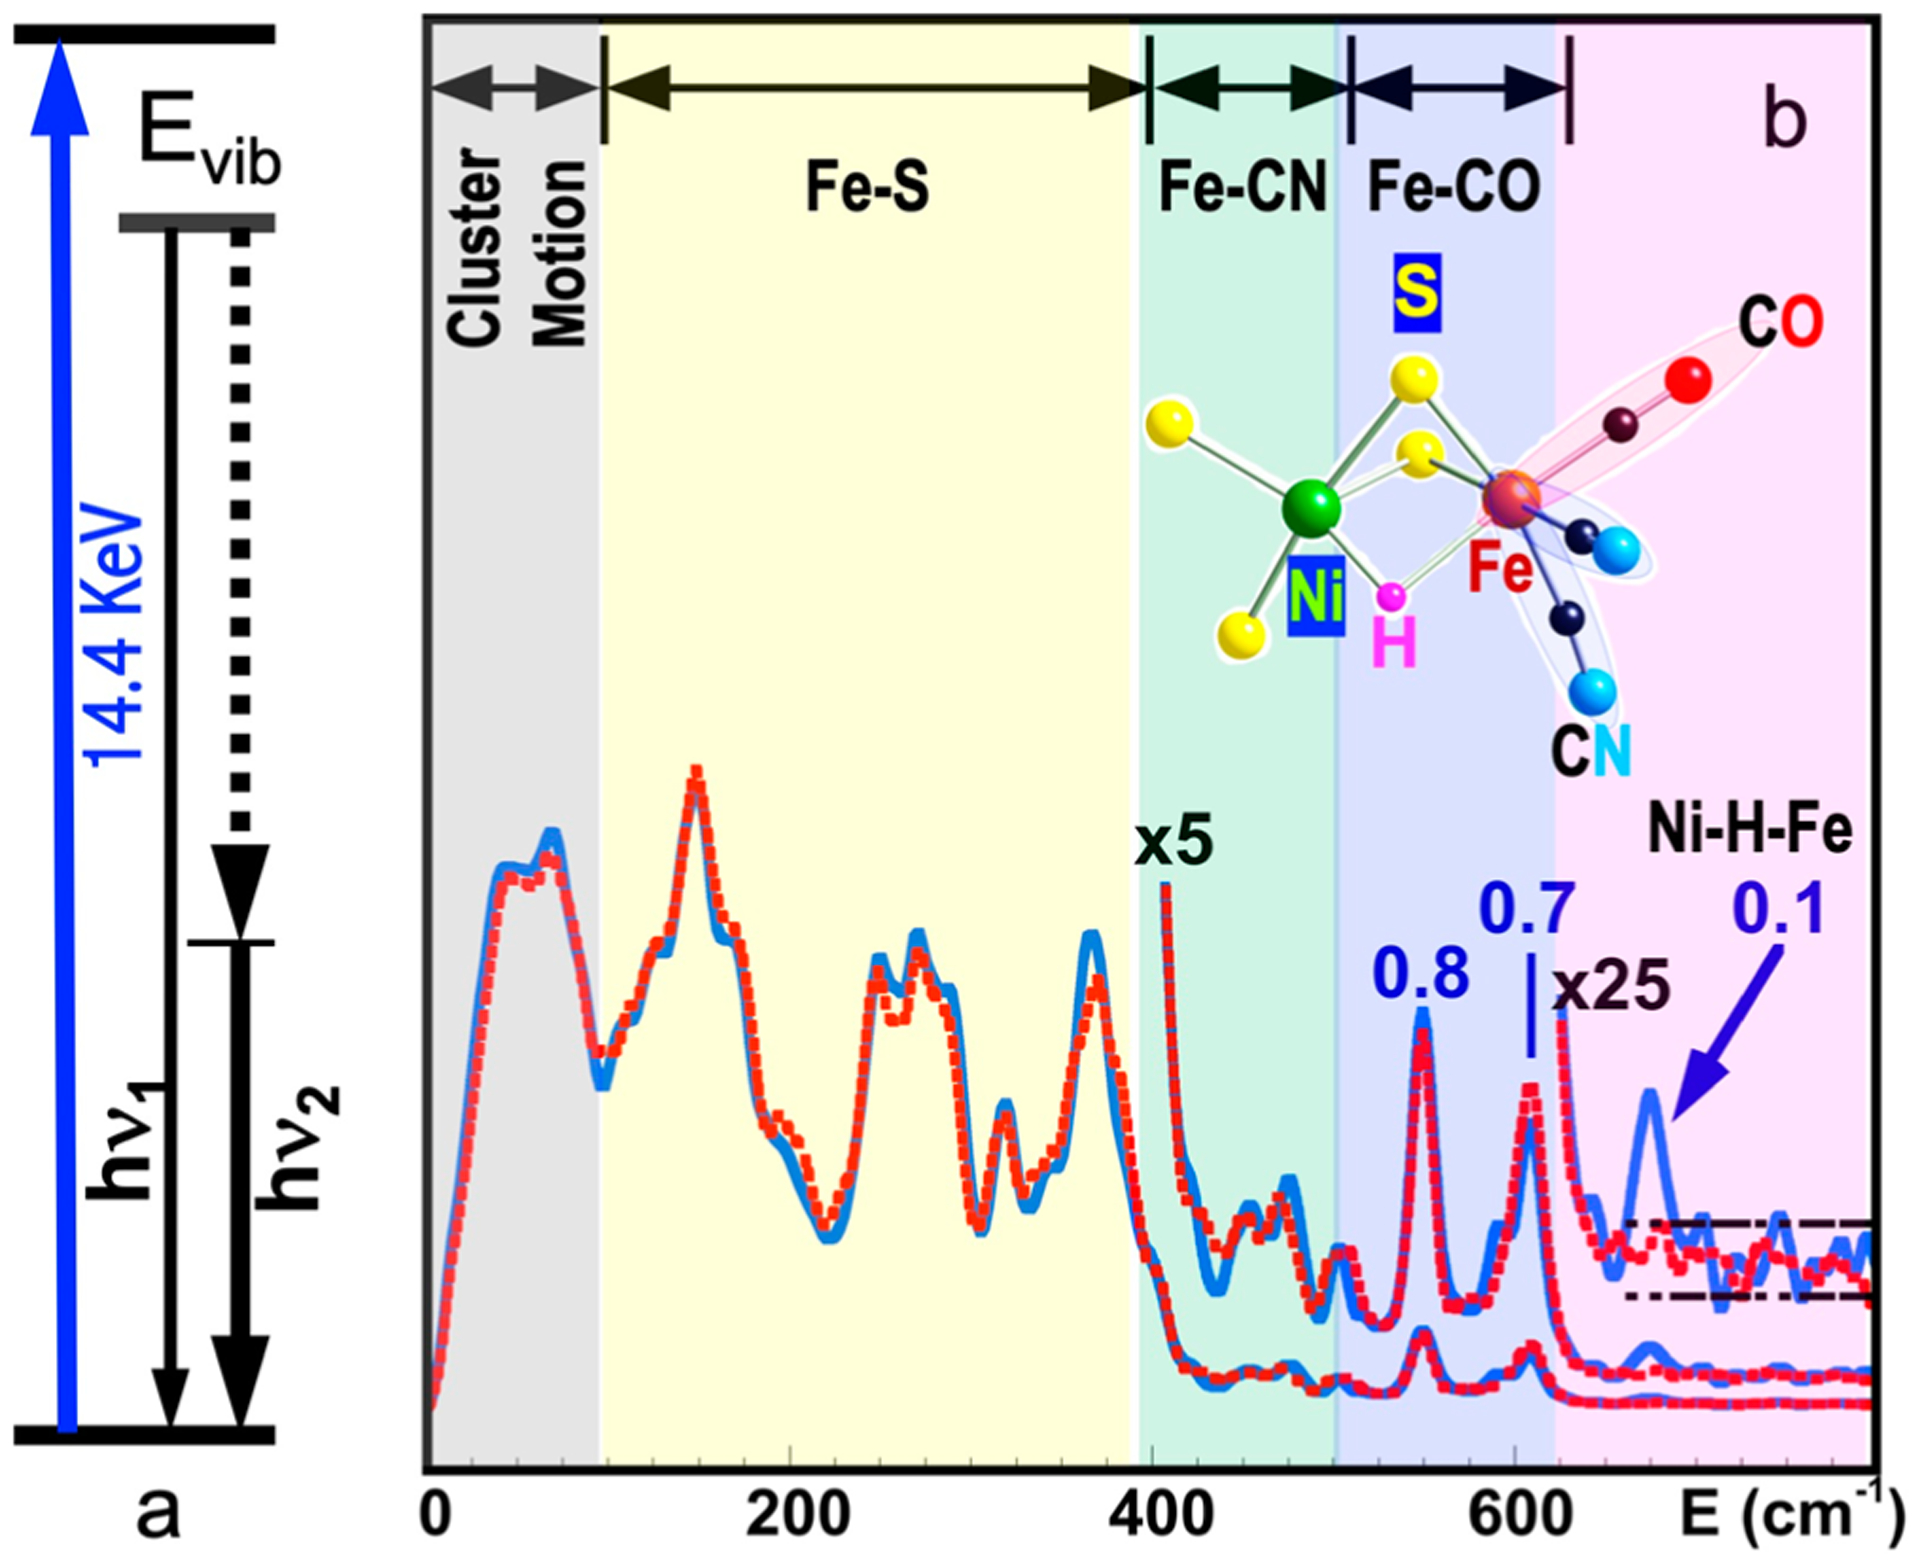
Figure 1.

(a) An illustration of NRVS transitions; (b) 57Fe NRVS spectra for DvMF NiFe hydrogenase (reaction center structure = insert) in a hydride (blue) and deuterated sample (red). The peak assignments (bold black text) and peak counts per second (the blue numbers) are given for the hydride sample (blue curves).
