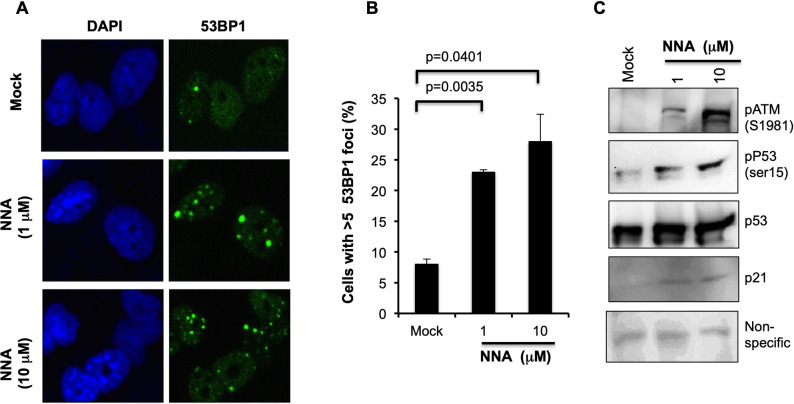
Fig 2. NNA exposure induced DSBs and activation of DSB response machineries.
(A) Representative images of 53BP1 foci staining 24 h after two doses of NNA (1 and 10 μM) exposure. Mock exposure control performed in parallel and represented at the top panel. (B) Quantification of 53BP1 foci 24 h after NNA exposure. Number of cells with more than five foci were counted and plotted as percent. Significance test was performed with two-tailed t test in comparison to mock exposed cells (p value <0.05). (C) Activation of ATM and its downstream p53 signaling pathway following exposure of BEAS-2B cells to the indicated doses of NNA for 24 h was analyzed by Western with anti-pATM (Ser1981) antibody. The same sample was probed for phosphorylation of p53 using anti-pp53 (Ser15), p53 and p21 antibodies. A non-specific band from the same gel was used as loading control.

