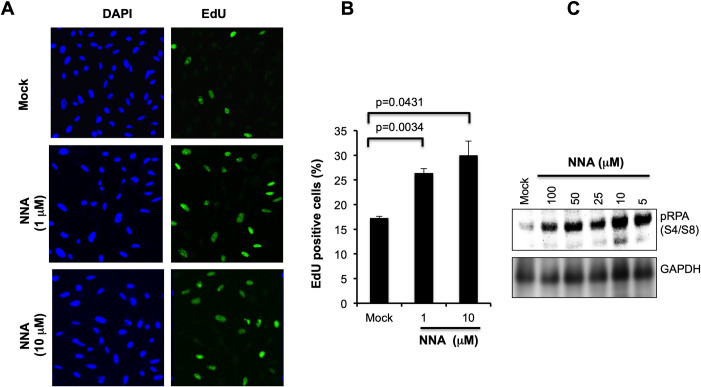
Fig 3. Proliferation analysis following exposure of BEAS-2B cells to NNA.
(A) Replication stress was monitored by Western analysis with RPA32 phosphorylation using phospho-RPA32 (S4/S8) antibody. GAPDH was used as a loading control for normalization of pRPA32 signal. (B) Cells were exposed to 1 and 10 μM NNA for 24 h followed by EdU incorporation for 4 h, fixed, permeabilized, detected with Alexa Fluor 488 by the Click-iT reaction (Invitrogen) and imaged. DAP1 stain confirmed total cell counts. Mock (DMEM only) exposure performed in parallel served as control and represented at the top panel. (C) Quantification shown as percent EdU positive cells. Data are presented as the mean ± SD from N = 3.

