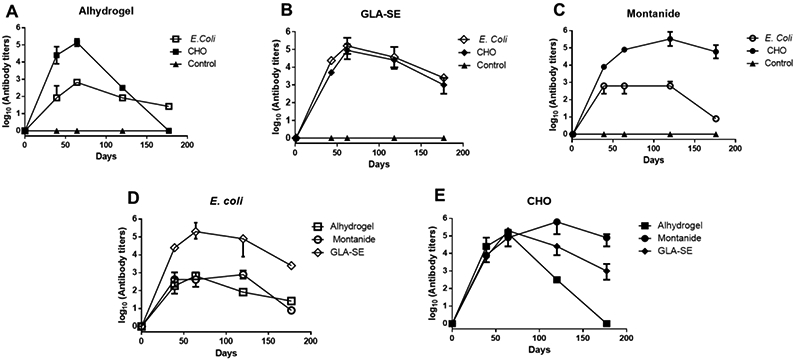
Figure 2. Antibody Titers.

Kinetics of antibody titers in BALB/c mice upon immunization with the full-length P. vivax rPvs48/45 proteins produced E. coli (open symbols) or CHO (closed symbols) formulated with (A) Alhydrogel, (B) GLA-SE, or (C) Montanide ISA-51. Each plot has its respective control group per adjuvant (▲). Antibody titers correspond to the last dilution of the test sera in which OD405 values were above that of the cut-off. The cut-off value was defined as the mean plus 3SD of OD405 value of pooled naïve mouse sera tested at 1:300 dilution. The median +/− IQR of each group is shown. (D and E) The same data presented in 2A-2C are plotted to compare the kinetics of antibodies among adjuvant groups against either E. coli (D) or CHO-rPvs48/45 (E) proteins.
