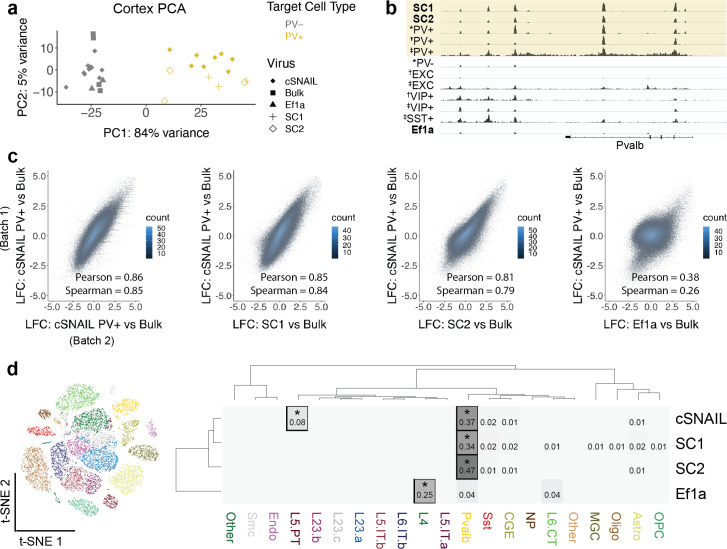
Figure 3. Cortical SC1 and SC2 Specific Nuclear-Anchored Independent Labeling (SNAIL)-isolated nuclei recapitulate parvalbumin-expressing (PV+) GABAergic interneuron ATAC-seq signatures.
(a) Principal component analysis (PCA) of ATAC-seq counts across samples. (b) Genome browser visualization of ATAC-seq signal at the Pvalb gene locus. Tracks represent the pooled sample p-value signal. Each track of similar data type is normalized to the same scale: SNAIL data range 0–335, *cSNAIL data range 0–93, †INTACT data range 0–200, ‡snATAC-seq data range 0–2. (c) Scatter plots of ATAC-seq log2 fold difference relative to bulk tissue ATAC-seq, comparing PV+ cSNAIL to other adeno-associated viruses (AAVs). The density of overlapping points is shown by the plot color. (d) snATAC-seq nuclei clusters as visualized by t-SNE. The dendrograms show hierarchical clustering of Euclidean sample distances by Ward’s minimum variance method D2. The heatmap shows the percentage of population open chromatin regions (OCRs) enriched relative to bulk that are also cluster-specific marker OCRs. *Hypergeometric enrichment p<0.01.

