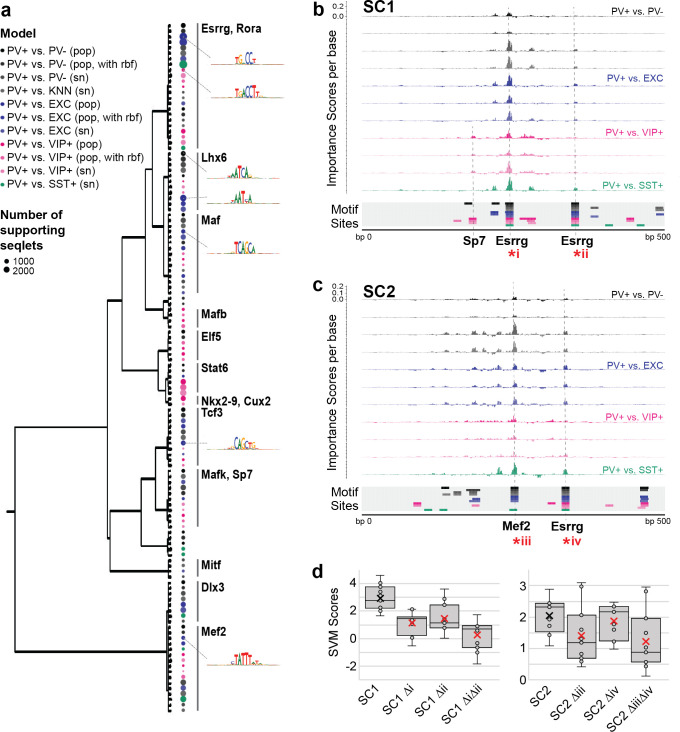
Figure 5. Motif interpretation of parvalbumin-expressing (PV+) neuron-specific open chromatin region (OCR) activity.
(a) Motifs with high contributions to PV+ scores in each support vector machine (SVM), clustered by sequence similarity. The bubble color at each node shows the model that motif was discovered in and the size of the bubble shows the number of seqlets supporting that motif. Clusters are labeled by the clade majority best match for known transcription factor binding motifs. The full list of matches can be found in Figure 5—source data 1. (b, c) Normalized importance of each base in SC1 (b) and SC2 (c) sequences for their PV+-specific scores in each SVM. Locations with sequence matches for identified motifs in each SVM (from panel a) are shown at the bottom. (d) Predicted impacts of motif scrambling on PV+ specificity. Motif mutation sites are shown with asterisks in panels (a) and (b). Each point is the sequence score from one SVM and ‘x’ is the mean.

