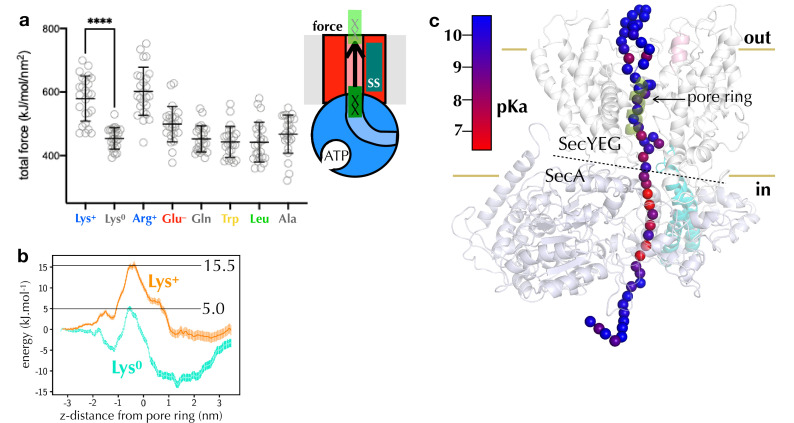
Figure 4. Computational analysis of pre-protein engaged in SecYEG.
(a) Pulling forces for regions of polypeptide containing different residues of interest to pass the SecY pore, as determined using steered MD. Plotted are the integrated forces along the pull coordinated, with 24 repeats for each residue. The mean and standard deviations are shown. (b) Potential of mean force pathways for a short region of peptide with either protonated (Lys+) or deprotonated (Lys0) present passing through the SecY pore. These systems were built using the Martini force field. (c) pKa scanning data for lysine residues at different positions along the substrate. Alpha-carbon positions of the substrate are shown as spheres, and coloured according to their calculated pKa.

